
Introduction
This case study explores the use of UAV image-based digital twins in afforestation and reforestation applications. Contrasted to traditional forest measurement techniques, which are based on many indirect estimates, digital twins aim to create a high-fidelity model of each tree, sufficient to calculate any allometric attributes (relating to the height, crown width, trunk width, or other geometric indicators).
Forestry digital twins are traditionally viewed at a high cost, but we mean to demonstrate that low-cost options exist which yield sufficiently high-quality models of forest growth, to minimize the need for traditional manual inspection work, allowing inspection work that does occur to be much more focused and valuable.
The study highlights the importance of low acquisition time coupled with high accuracy in surveys as critical steps to understanding progress toward urban greenery goals.
The use of multispectral imagery and geostatistical analysis is practiced as a more accurate and efficient solution compared to fully manual approaches. Finally, the study involved the creation of field applications for inspection and the general public, to demonstrate how fieldwork and stakeholder information sharing might be conducted with assistance from UAV and remote-sensing data.
Background Research:
General interest in afforestation has been growing in the past several years due to increased awareness of the pollution problems in Almaty.
Almaty City has announced several plans to increase the number of trees in the city, but a reliable baseline for the number of trees doesn’t exist.
Several known causes of deforestation or tree loss exist in the city: illegal cuttings, pests, disease, and irrigation issues. However, the extent of these issues is not known.
Progress to Goals
Before embarking on any afforestation project, goals need to be established based on the current state. If a target number of planted trees is chosen, but assumptions about progress to the target are based on outdated techniques, the goals aren’t meaningful.
For example, if a target of eight million trees by 2025 is chosen, but a flawed survey estimates that there are already seven million trees, an increase of only 15% in current planting efforts is required. If a survey estimates current trees at four million, efforts need to double to hit the goals.
It’s particularly important, therefore, to have accurate surveys to understand the progress toward urban greenery goals.
Health
Tree health can be measured locally, but the survey time to cover all trees is measured in decades. Approximately 4-6 years are required to hand survey the entire city area (760 sq. km.) if the current survey methods are used.
This is plenty of time for entire groves to become infected with blight or affected by irrigation issues. By the time inspectors discover the issue, many trees may already be dead.
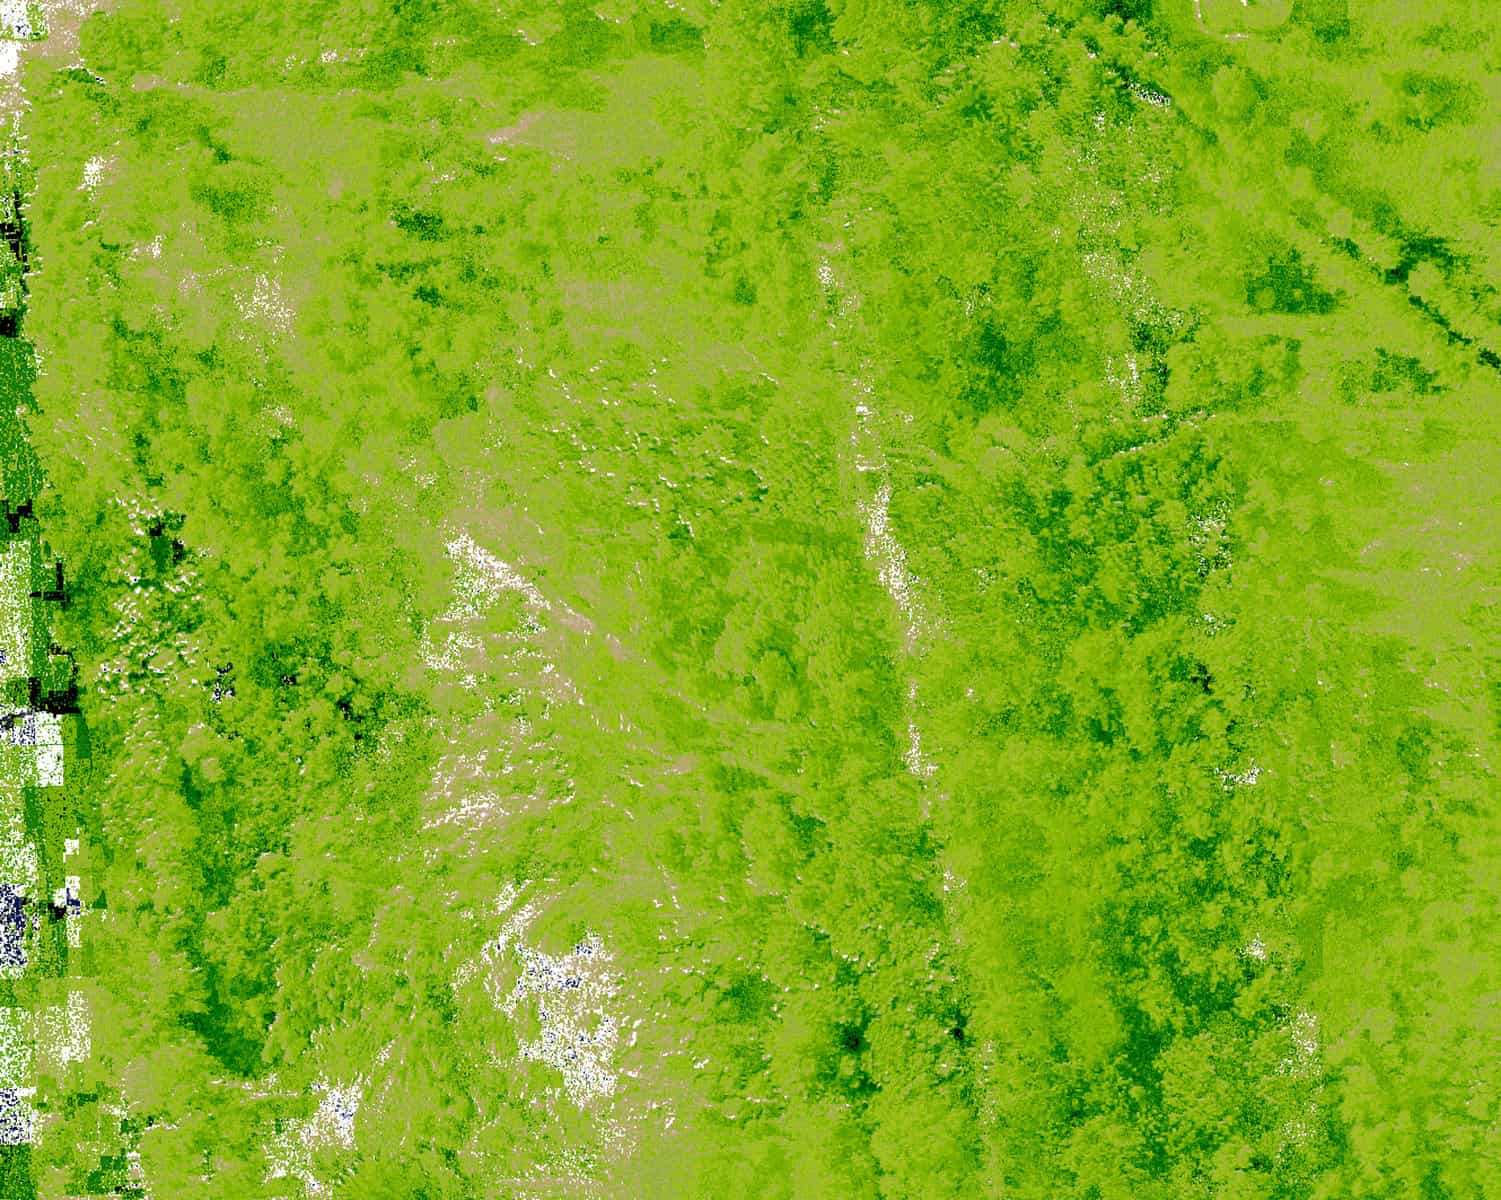
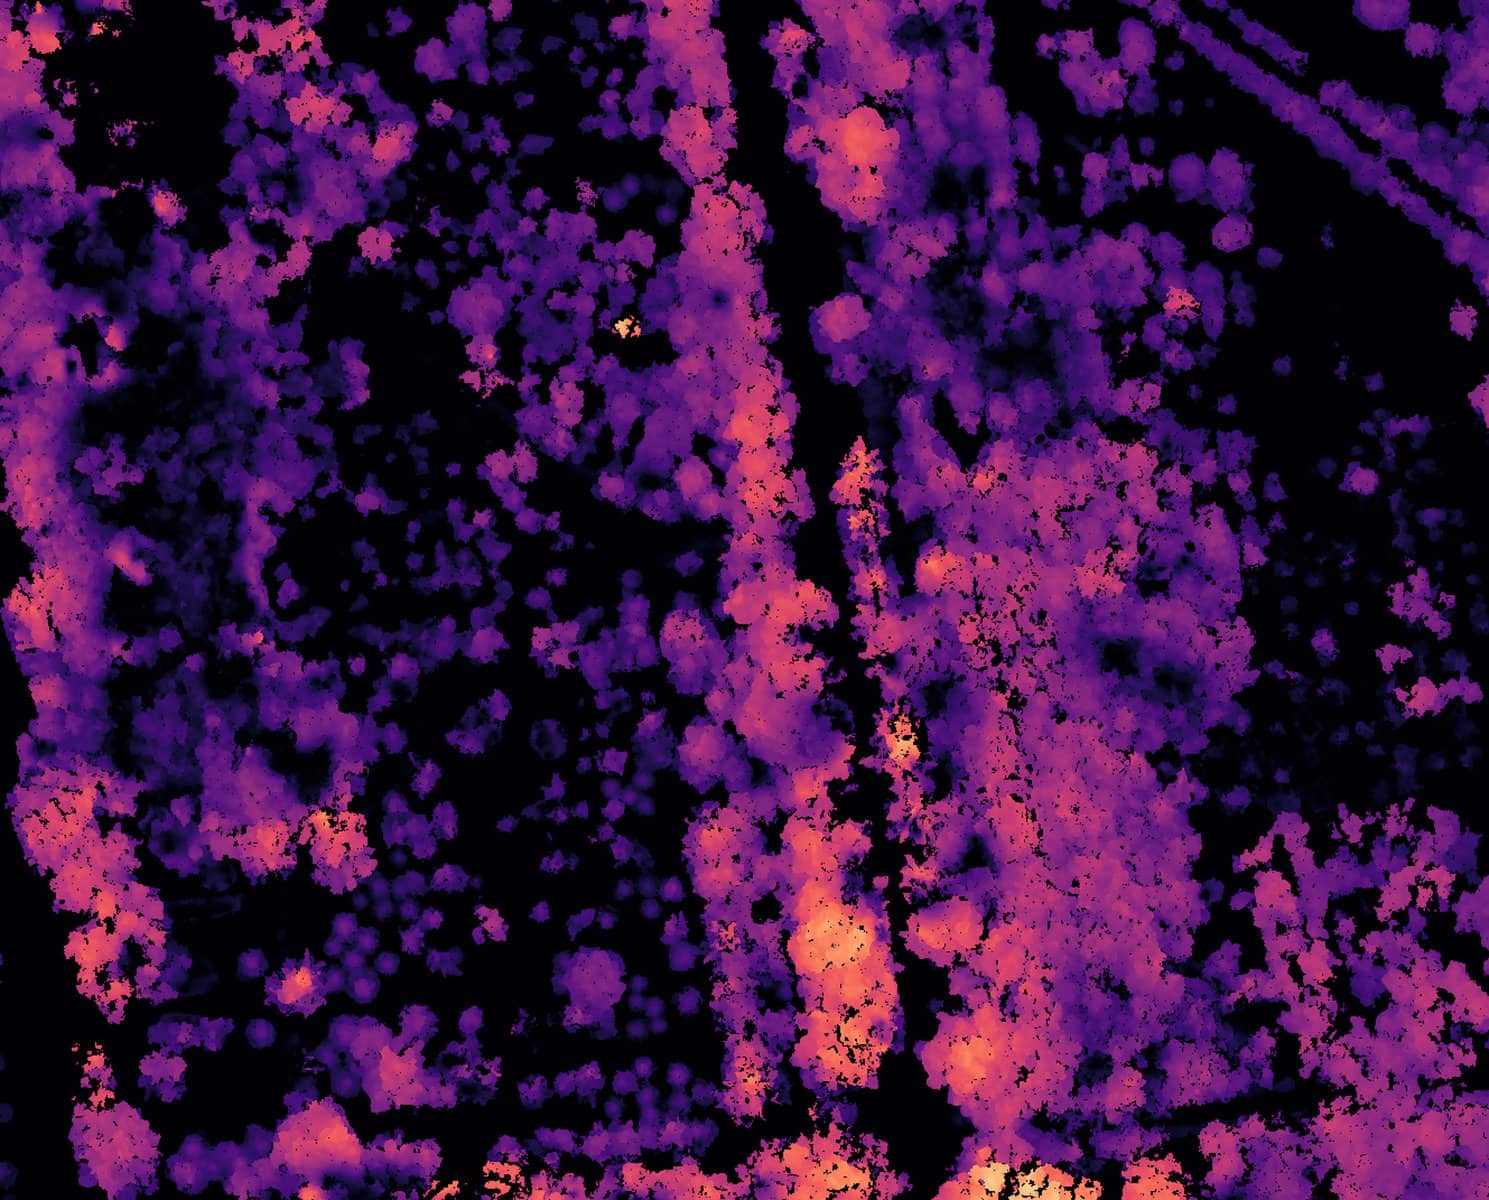
By contrast, satellite imagery like the Sentinel 2A multispectral image shown below, is available every 10 days.
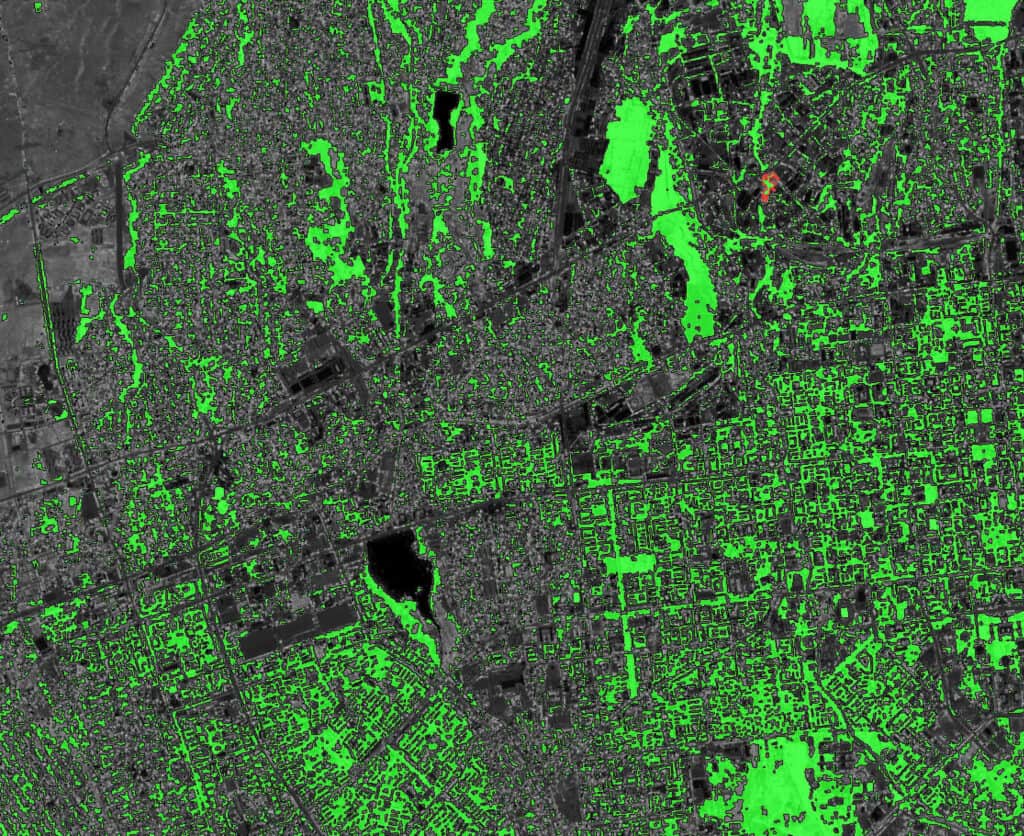
The usage of the Sentinel 2 imagery is a step in the right direction.
In the image above, we’ve used Trimble eCognition, coupled with the NIR band of the Sentinel 2 image of Almaty. With the MRS (Multi-Resolution Segmentation) algorithm, the areas covered by foliage are segmented out relatively easily.
The total area of all green areas can now be sampled, and an initial estimate of the number of trees can be determined.
It’s important to ensure repeatable quantification for urban trees. The exact number of trees doesn’t matter as much as the rate of increase or decrease, and the regions where trees are being added or lost.
Using NIR imagery shows sharp contrast between vegetation and urban spaces. This creates a stable and repeatable algorithm and output. This stability has several advantages.
Changes in forest areas can be monitored frequently, providing an early warning system on illegal cutting, a severe problem in Almaty. If land use changes from forest to pavement, even just a small amount, there can be large impacts on the overall percentage of green cover.
Aside from the benefits of monitoring urban sprawl, ten-meter imagery from Sentinel 2 isn’t as useful for afforestation monitoring. New plantations of trees show as a single mass, and the health of forest stands is representative of many thousands of trees.
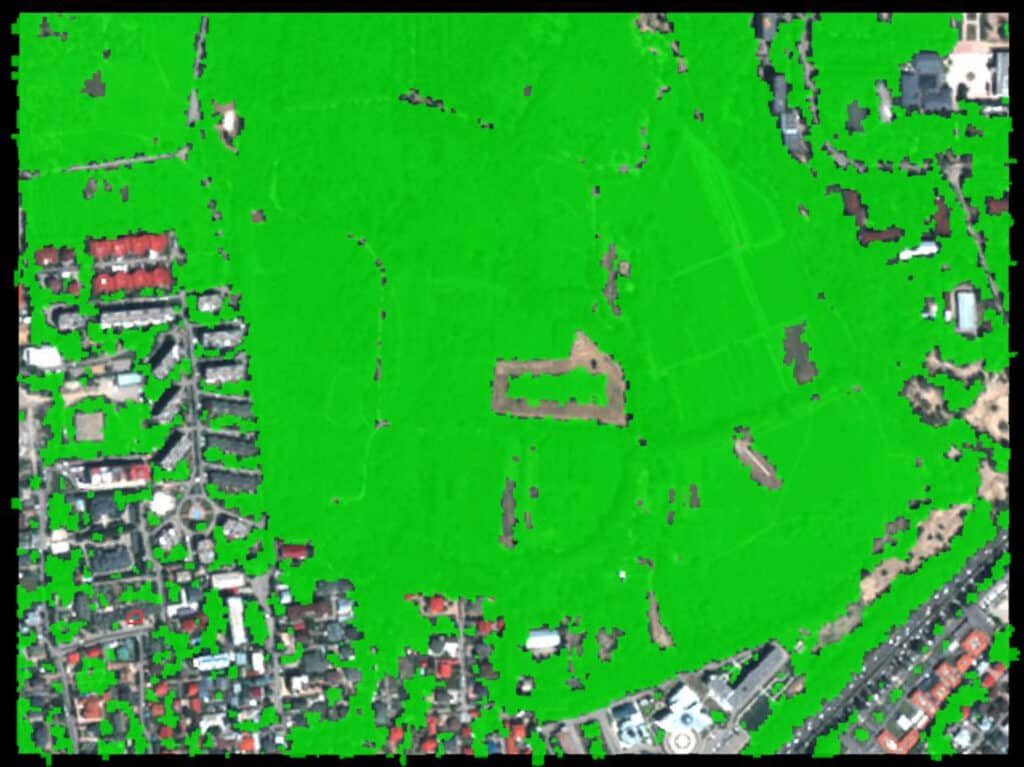
Close-up, individual trees aren’t visible at all. However, clusters larger than 10m are picked out, and many tree areas on the side of the road are visible.
Third-Party Surveys
When looking at data available from other parties, we also considered satellite and aerial imagery.
In satellite imagery, the top option was Planet Labs’ subscription services: Planet can provide daily imagery at 3.7m resolution through Planet Monitoring and the PlanetScope constellation of satellites. The early detection ability is about ten times better than ESA’s Sentinel 2 satellites; however, the cost of subscription is quite high.
Other options: Airbus, Maxar, and Planet all offer 0.5m-class imagery that can be tasked or requested from the archive. Besides being expensive and one-off, the imagery also isn’t high enough resolution to resolve individual saplings in afforestation.
We estimated that saplings were below 15 cm wide, so to obtain digital twins of them, we need a much higher resolution than what is available by satellite.
Aerial Imagery
High-resolution aerial imagery fits between UAV and Satellite imagery in terms of cost and performance and is used by cities throughout the world to perform urban forest inventory.
GPSCom, rTek’s partner, operates a Vexcel Ultracam. However, we haven’t managed to arrange for a large enough pilot project to enable flight over Almaty (which has never been done and would require approval by various government entities).
Ultracam imagery is used routinely in Bing Maps Aerial, to show ultra-high-resolution maps of entire cities.
Similarly, HxGN’s Leica CityMapper is a near-perfect solution in terms of data generated. These aerial systems fly on a small airplane and collect ultra-high resolution 3D models through a combination of RGB and multispectral cameras and LiDAR.
Unfortunately, considering all equipment needed, a solution using aerial imagery ultimately would cost millions of dollars.
UAV Imagery
Early on in our research process, we understood that UAV imagery would likely be required. It can be collected quickly for a small area, and with a large UAV, it can be collected within a reasonable amount of time for the entire city-scale dataset.
The City of Almaty Department of Architecture, in 2019-21 commissioned a full-city UAV scan (available at uaig.kz). Unfortunately, we found issues with the dataset that made it unsuitable for this purpose.
- Although the data shows the most promise of many of the datasets we’ve reviewed, large sections were performed during the winter with leaves off. It’s obvious that the process took many months, or even over a year to complete the whole scan.
- During that time, we spotted drone pilots in the city with DJI Phantoms riding around on scooters. The spatial accuracy of the Phantom 4 is about 3m, which isn’t quite enough to do repeated scans or to get an entire city to stitch together properly.
rTek has experience with this – having mapped entire city areas of over 10k+ ha at five centimeters per pixel GSD (Ground Sampling Distance) with a UAV. The acquisition time for ten thousand hectares takes about a week. Almaty is 76 thousand hectares, so it would take a month or more, but it’s definitely a feasible task.
Still, we’d like to look more at third-party data before we start making assumptions.
Ground-Based Data
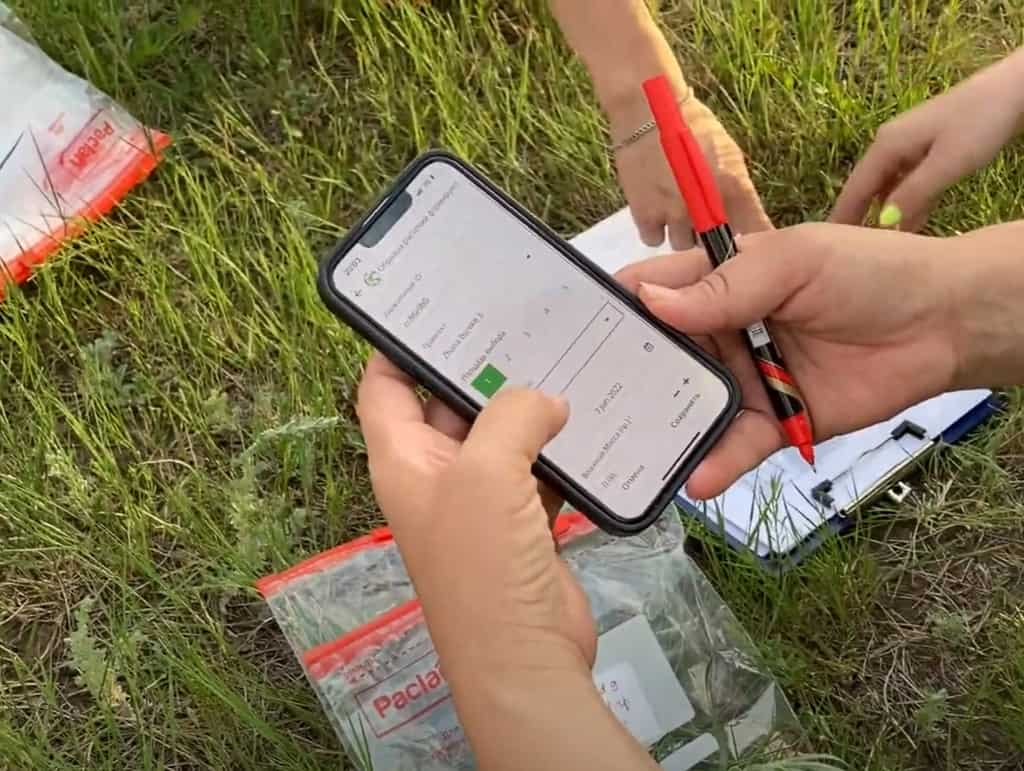
Ground data should be the best quality, using GPS and a smartphone app to collect data on trees. However, Almaty inspectors use a paper-based process, which introduces some errors.
We were able to look at the ground-based map created by EcoAlmaty, which has been digitized over time from paper to an ArcGIS Shapefile. Although a great start, we can see at a glance that only certain areas were inventoried.
AGP (Almaty Gen Plan) data showing 100k trees in all of Almaty. We expect 5-10M, so roughly 98% of trees were not counted in this survey.
By methodology, we know that the inspectors walk in the local area, make an estimate of the tree density, and perform spot checks on individual trees for disease and other issues. However, the dataset doesn’t present densities or any of the raw data – it only shows points where there are none.
From the closeup, (red Xs are hand-counted trees), we can see that trees are placed in natural locations, but often where there are no trees at all. These trees have height, crown diameter, species, and a host of other attributes, but it’s unclear if the trees actually ever existed.
Many clusters of trees have identical allometric data, showing that the process doesn’t involve unique trees, but rather batches of estimations.
Other Ground-Based Options
Several urban forestry inventory projects exist around the world, using innovative techniques.
TreePedia/Street View Imagery
For example, the MIT TreePedia project uses Google Street View images sourced by Google and the community, to create models of tree density and canopy cover in cities around the world. What’s great about this project is that the algorithm is open-source, and anyone can use it to access Street View imagery and create a map of urban forestry.
On one hand, being free and using open data and algorithms, this concept is near-perfect, but a couple of issues exist, however:
- Focus on canopy cover: canopy cover affects the urban quality of life, through shading and hot-island temperature reduction, among other things. Therefore, this project focuses on calculating a “Green View Index,” which doesn’t directly apply to biomass or tree health.
- Dependency on streets: street view spherical panoramas typically cover only streets, although some park walkways are also covered. In Almaty, there are a large number of greenery buffer zones that are naturally forested. Acquiring tree inventories only from streets misses all of these zones.
LiDAR mapping from a vehicle
Our friends at Leica Geosystems have a Pegasus unit that was used to map Astana. Unfortunately, this solution also has some drawbacks. Besides having a high cost of rental, it is also street-based, meaning that we would omit all trees in green buffer zones.
Background Review
Before we start creating a solution, we want to look at all available options and research that has been performed in the past. Several studies have been conducted using similar satellite-based techniques, finding Almaty a relatively green city, but with the potential for more ‘greenification.’
Already with satellite imagery, we have a better tree map than has been produced through ground-based, paper-based manual counting. And on top of that, the Sentinel data is free, and new observations are made every 10 days, so the capability of working as an early warning system is quite good.
Older UAV datasets were acquired during winter in some parts, so trees are not visible, as the majority of trees in Almaty are deciduous.
Aerial imagery or LiDAR would be a complete solution, but it is too expensive for Almaty City to fund. Previous UAV work covering the entire city implies that regulatory and financial approval is possible for such a task.
Hypothesis
Given the flaws with coordinates and counts in the ground-based data, we expect other attributes (like height, trunk width, and crown width) to have similar flaws on the order of 30-50%.
By collecting UAV data and using algorithms designed for Leica CityMapper and similar ultra-high resolution aerial imaging systems, we can create a repeatable model without re-inventing any systems or algorithms, and vastly improve the base dataset.
We can then utilize field apps to enable local inspection, accessing data from the field, and adding additional information that can’t be added by UAV.
Existing commercial techniques can calculate tree locations, height, and health using ~5 cm/px photogrammetry. We’ll investigate the use of LiDAR on another site, as an alternative to photogrammetry.
Just by implementing existing tools, we expect that we can create a much more accurate dataset, which can be further refined in the future by reassessing the base data.
Machine learning models will be tried, but it’s expected that processing the data through traditional techniques will have more statistical repeatability and better error diagnostics.
Data Collection
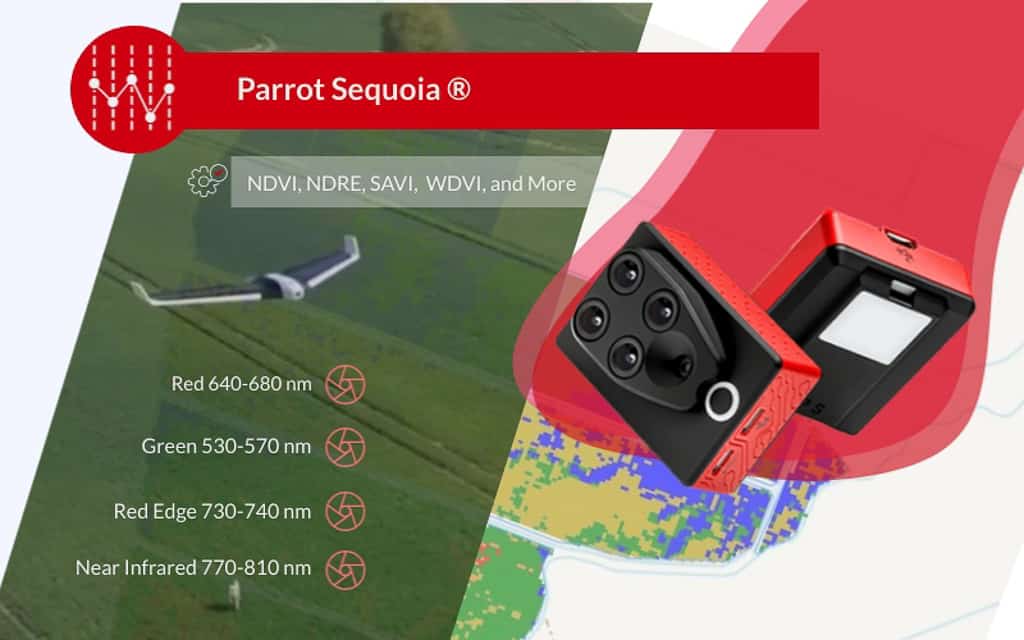
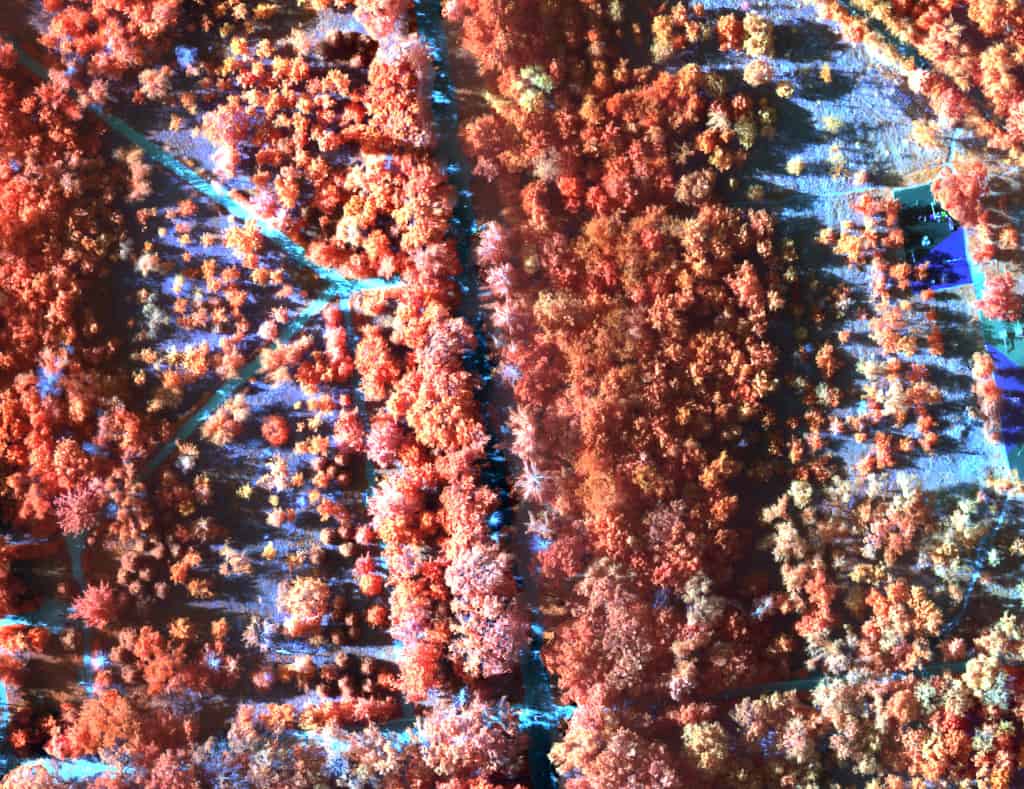
We collected an RGB-RE-NIR dataset from a UAV in a sample area of Atakent Park. The Parrot Sequoia (multispectral camera with its 735nm (Red Edge) and 790 nm (NIR) bands) is an ideal system for the assessment of tree health. Because of its GoPro form factor, it’s also mountable on nearly any platform. We collected the multispectral data at 15 cm resolution.
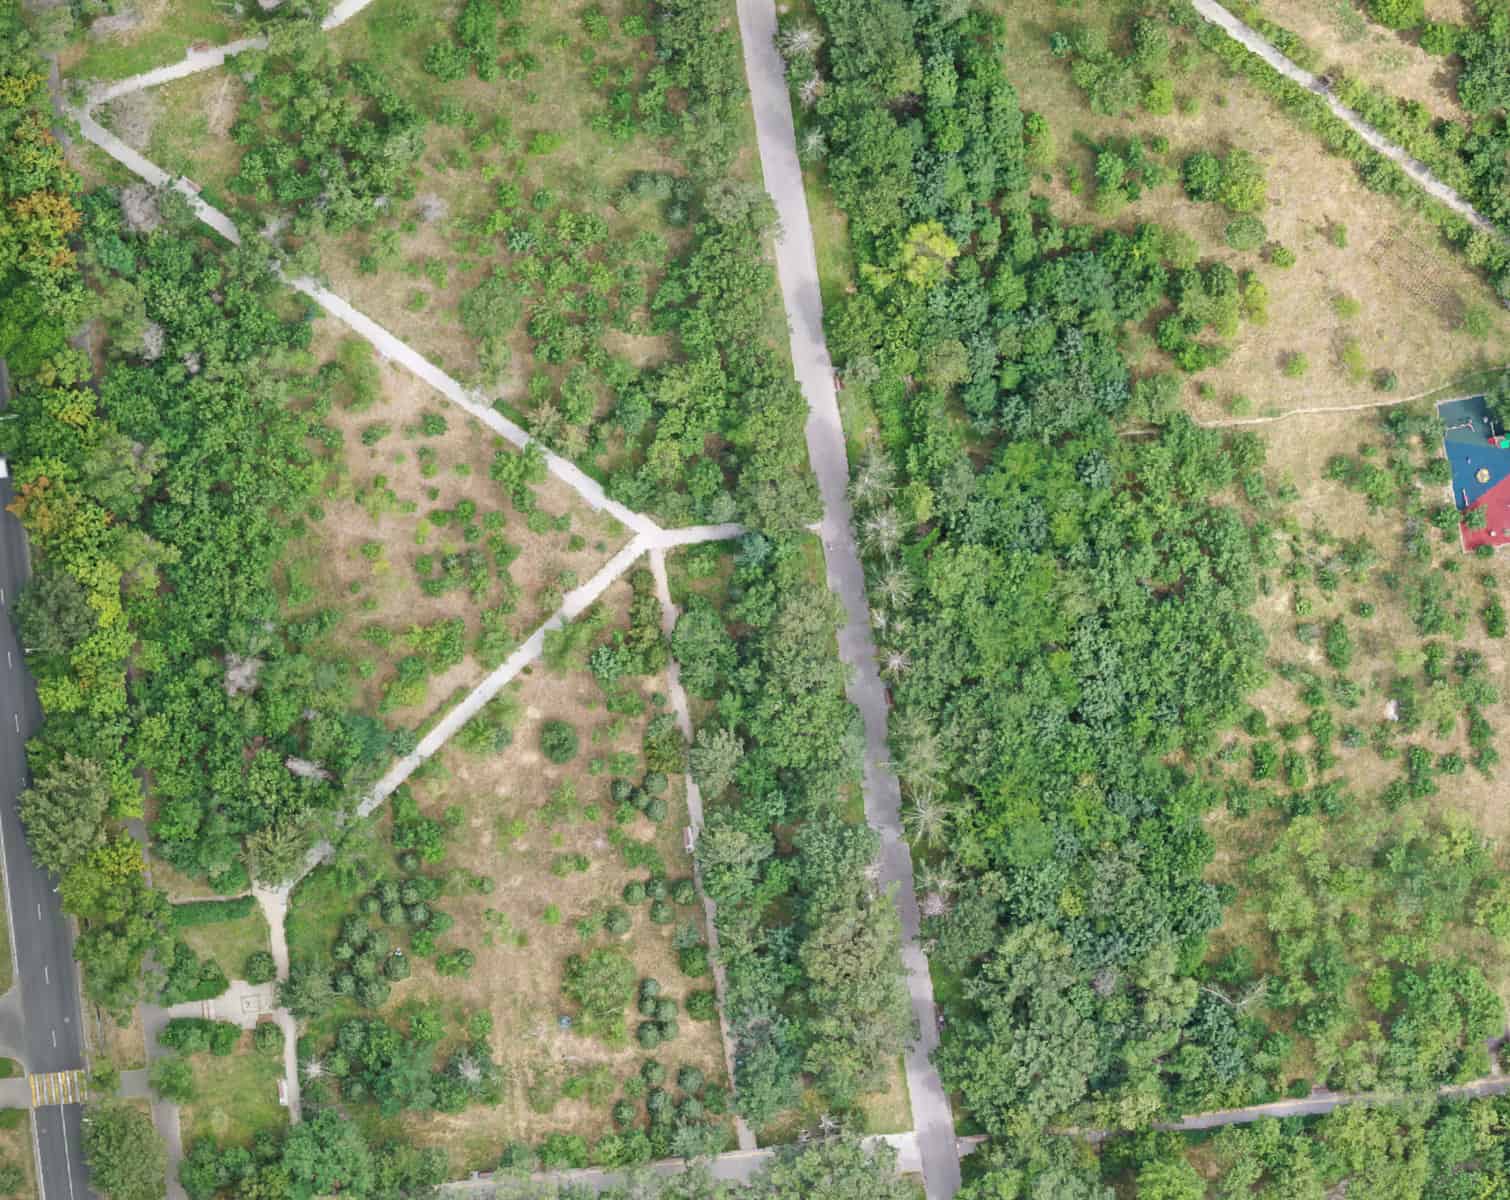
The DJI Mavic 2 Pro was used to collect RGB imagery in this case study. Its sensor is capable of capturing high-quality imagery with a resolution of 5 cm ground sample distance.
This makes it ideal for orthomosaic imagery, which requires high-resolution imagery to create a seamless, accurate map of an area. Additionally, the Mavic 2 Pro’s sensor is capable of capturing imagery in low-light conditions, making it a versatile tool for data collection in various environments, including shaded areas between trees which would otherwise not be captured.
Creation of Orthomosaics
An orthomosaic is an aerial photograph that has been corrected to account for distortions caused by terrain or camera distortion, resulting in an accurate representation of the Earth’s surface.
It is typically created by stitching together multiple overlapping aerial images to create a seamless, high-resolution map of an area.
In this case, we made two orthomosaics – one from RGB images, and one (each) for each multispectral image band. Orthomosaics made from photogrammetry must compute 3D positions and 3D models in order to stitch them together. The 3D models can then be further broken down into elements.
When multispectral bands are captured in near-infrared and red-edge bands, we can combine them into an index: NDVI. NDVI is quite useful in high-resolution scales to determine microscale differences in vegetation health.
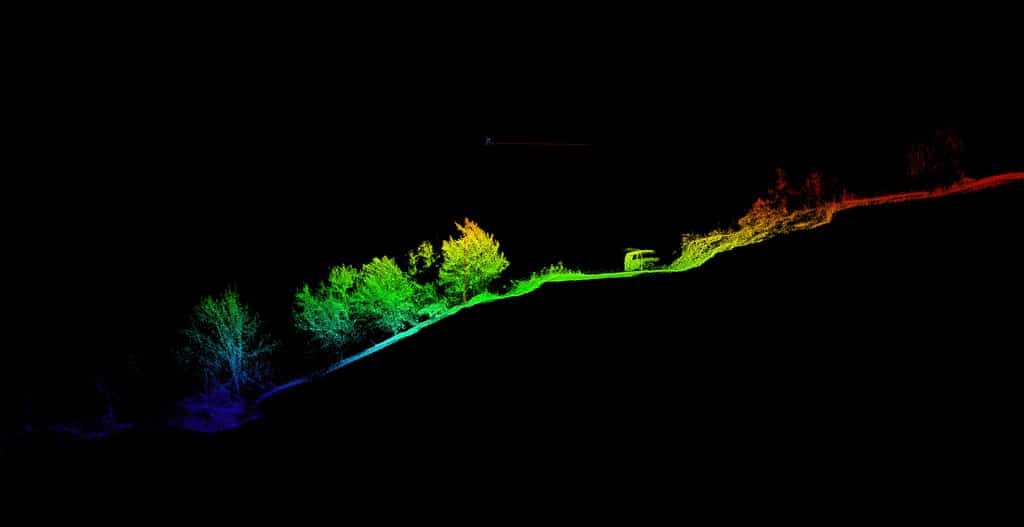
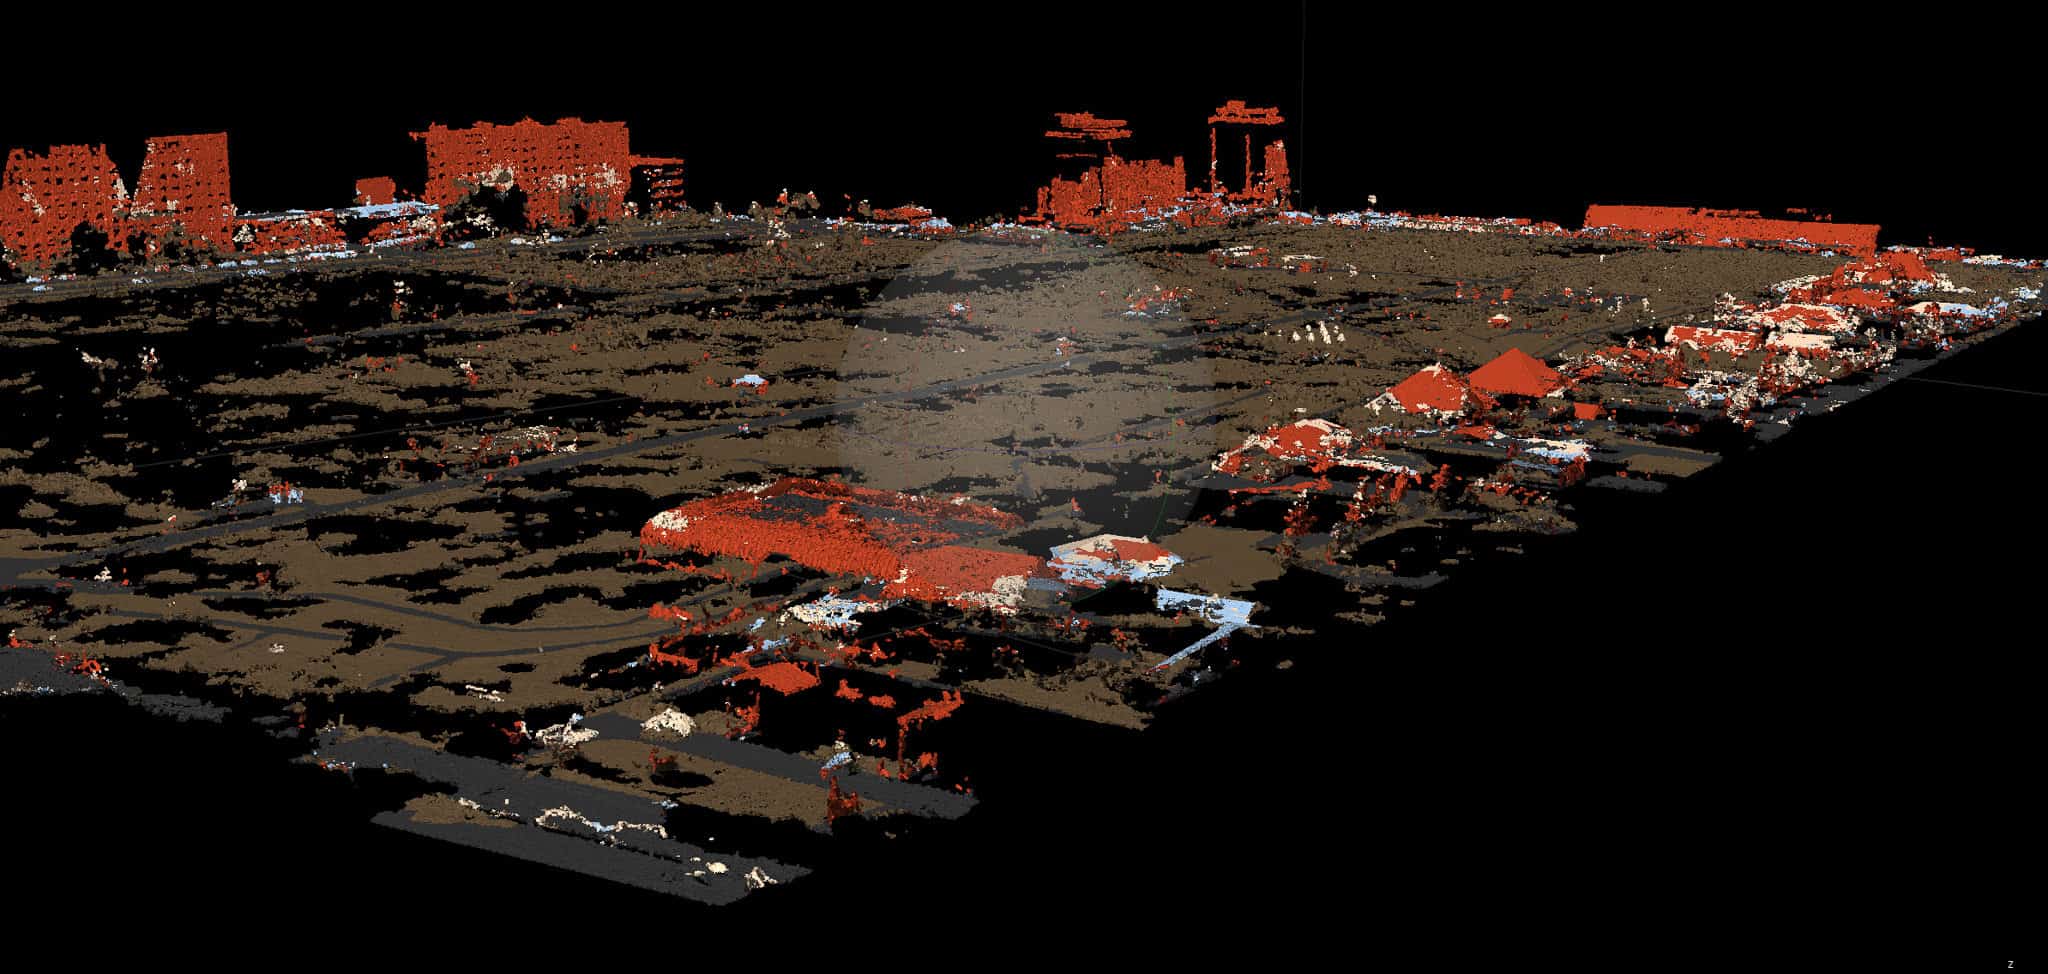
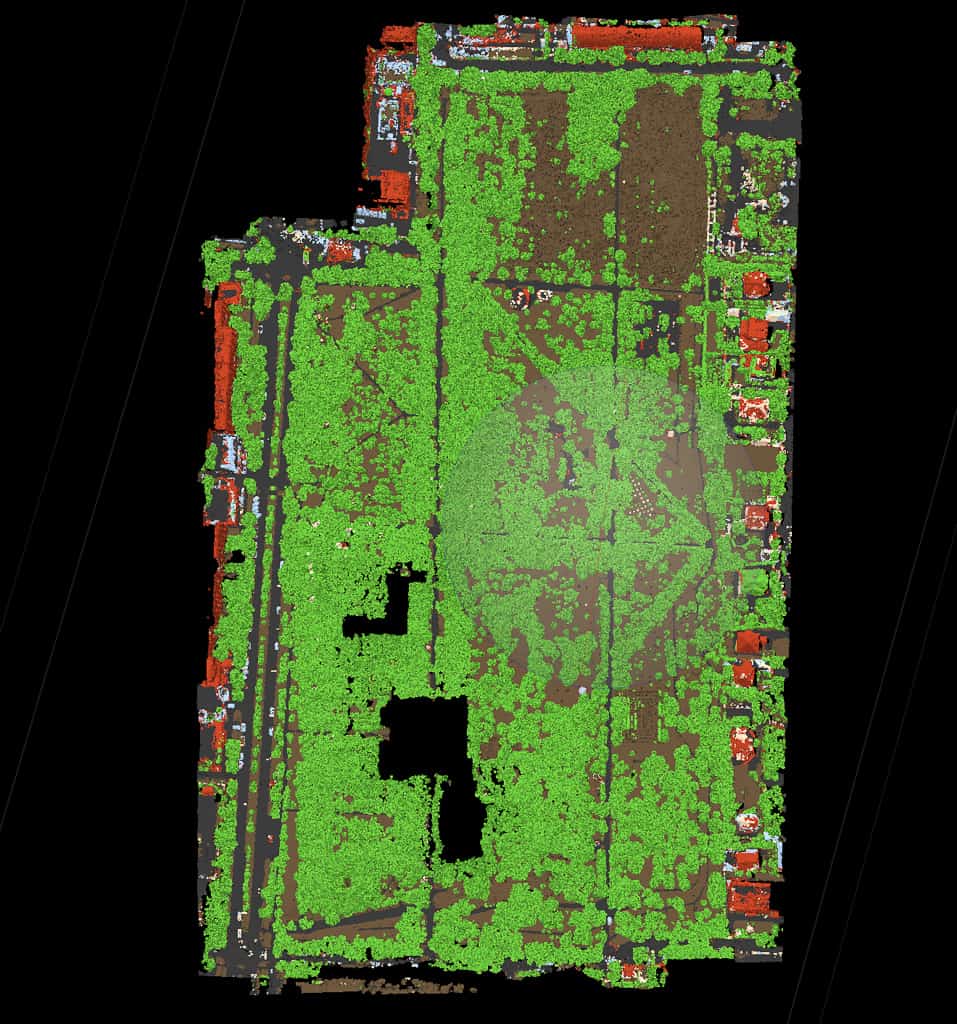
Vegetation is segmented by the green channel. Anything green and standing above the ground surface is automatically classified as vegetation using ML point classification. Other objects are segmented by their respective types: buildings (red), cars (blue), hard surfaces (grey), or dirt (brown).
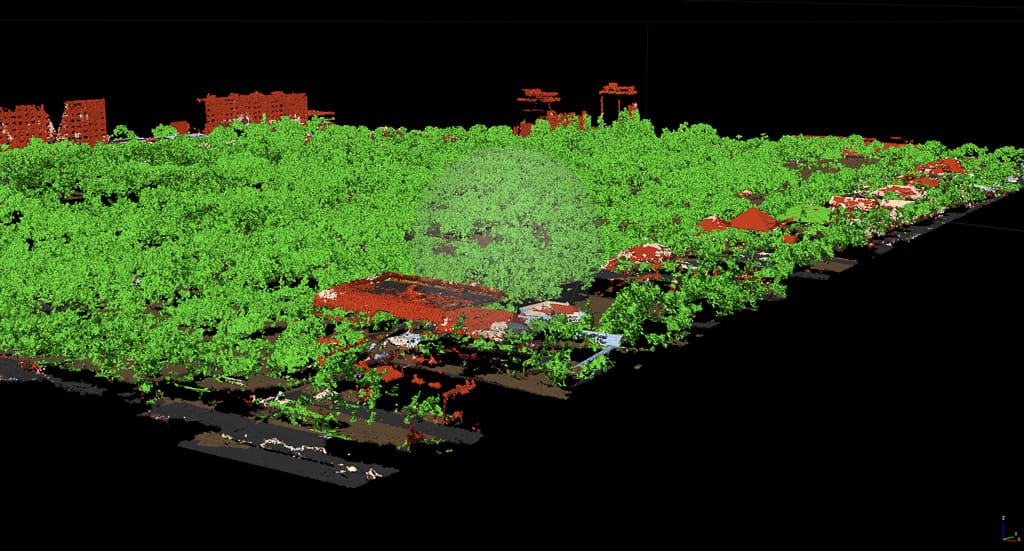
Point clouds have a variety of uses, not just inventory of above-ground objects. With auto-classification of ground points, we’re also able to extract a digital terrain model by interpolating between the ground points.
We can also gain a lot of contextual information by examining the point cloud visually. The homogeneity or heterogeneity of our tree stands are quite easily assessed by looking at different areas.
Tree Identification
There are a number of algorithms dedicated toward identifying individual trees given an input point cloud, including LiDAR-based and ML-imagery based. We took another approach, which uses a 3D model to identify crown peak locations.
ML models have some unknown reasons for variability, depending on feeding multiple resolutions into the model, or using different sensors. In contrast, a crown-location approach uses the 3D model, which is a standard type of data. This makes it much easier to identify any sources of systematic error.
The NDSM is a normalized intermediary elevation layer, so it doesn’t matter what image resolution we start with, or what type of camera we use, since we smooth the data to obtain a common resolution before passing it into the crown detection algorithm.
To make an NDSM, we first sampled the ground points that were part of the point cloud, and filled and smoothed the area between them to create a DTM.
We then subtracted the DTM from the DSM, including only trees. From there, we used a crown detection algorithm, with some smoothing (Gaussian resample) parameters, to find tree centers.
Crown detection algorithms use local maxima to find the tree locations but filter out small objects like branches. They’re very repeatable, and have inherent false positive and false negative errors, but because of the stability of the algorithm, we’re confident that we know the error rates quite well (around 1-2% for both).
Sapling Issues
Another issue we found was related to the NDSM resolution. With low enough resolution, some trees aren’t visible at all.
When we collected UAV imagery at 5 cm/pixel, no trees were detected in this large brown patch of land at the lower right side of the image above. With photogrammetry, the pixel size needs to be significantly smaller than the smallest object. Objects three pixels wide or larger can generally be detected.
With many of the saplings just 5-8 cm across, we needed around 1 cm/px. in order to definitively inventory each sapling. This required us to re-fly just the new sapling area.
Below, you can see the strict patterning layout as a result of new plantings, and the ~2.5k saplings identified in that zone which had appeared barren before.
Multispectral images were acquired at 15 cm/pixel ground sampling distance. This means that many saplings have one or fewer pixels of coverage. Instead of measuring sapling health/NDVI directly, we took a step back.
We asked: what is the most likely cause of a sapling’s health to decline?
The issue we can control is irrigation. Saplings are watered with drip irrigation, causing a circular area of around 50cm around each sapling to receive water.
Instead of detecting sapling health, we simply use the grass growing at the base of the sapling as a proxy for drip tube functionality.
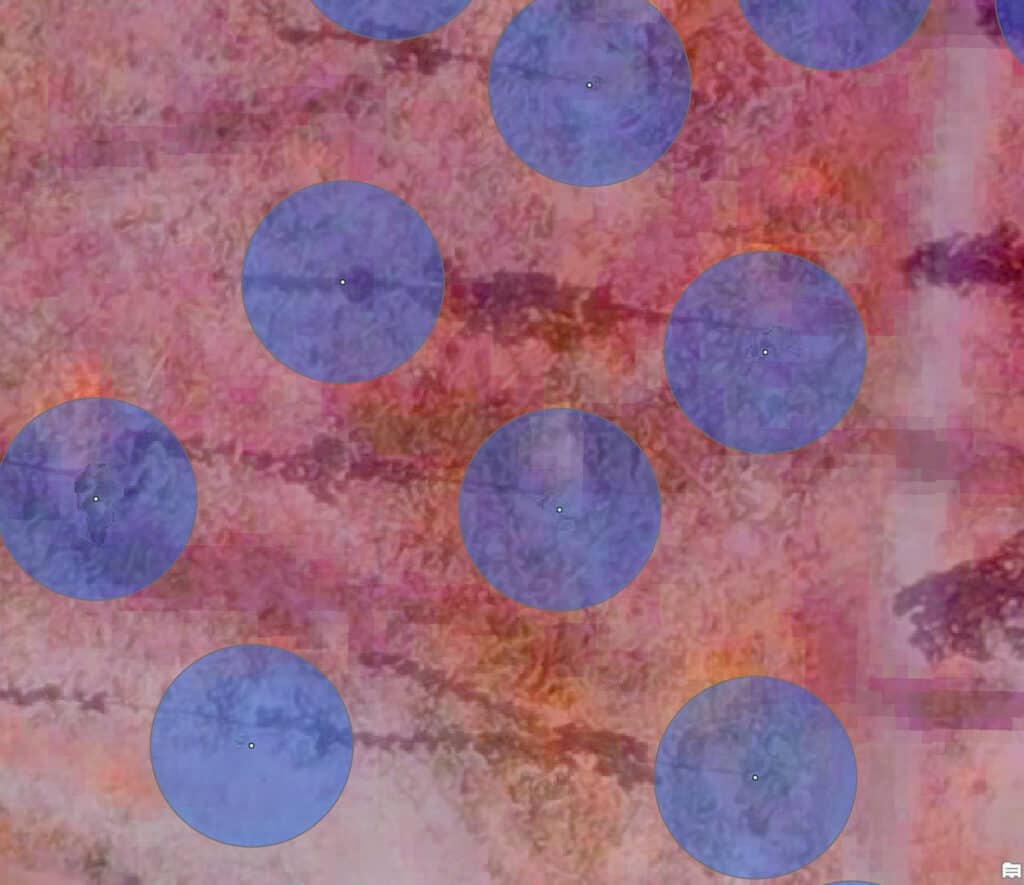
If the irrigation system is functioning well, the NDVI value inside our buffer zones should be consistent with neighbors. We averaged NDVI throughout the buffer circle and applied this value to each tree object for representation on statistical charts.
We could have also resampled the UAV-multispectral imagery at ~5 cm/pixel, flying at just 30m. Besides requiring terrain following and obstacle avoidance, the data volume would have been very large. Overall, we decided against going this route, since it would not be feasible on a large-scale operation anyway, and one of the primary purposes of this project is to find a balance between scientific accuracy and economical operation.
Satellite Data
For historical data, we collected an image from each month going back a couple of years. This data was then overlaid with the point map containing every tree. SHP files like this one can have as many attributes associated with the points as we want, so we “enrich” the points with sampled data from each month in our historical archive.
Adding App Functionalities
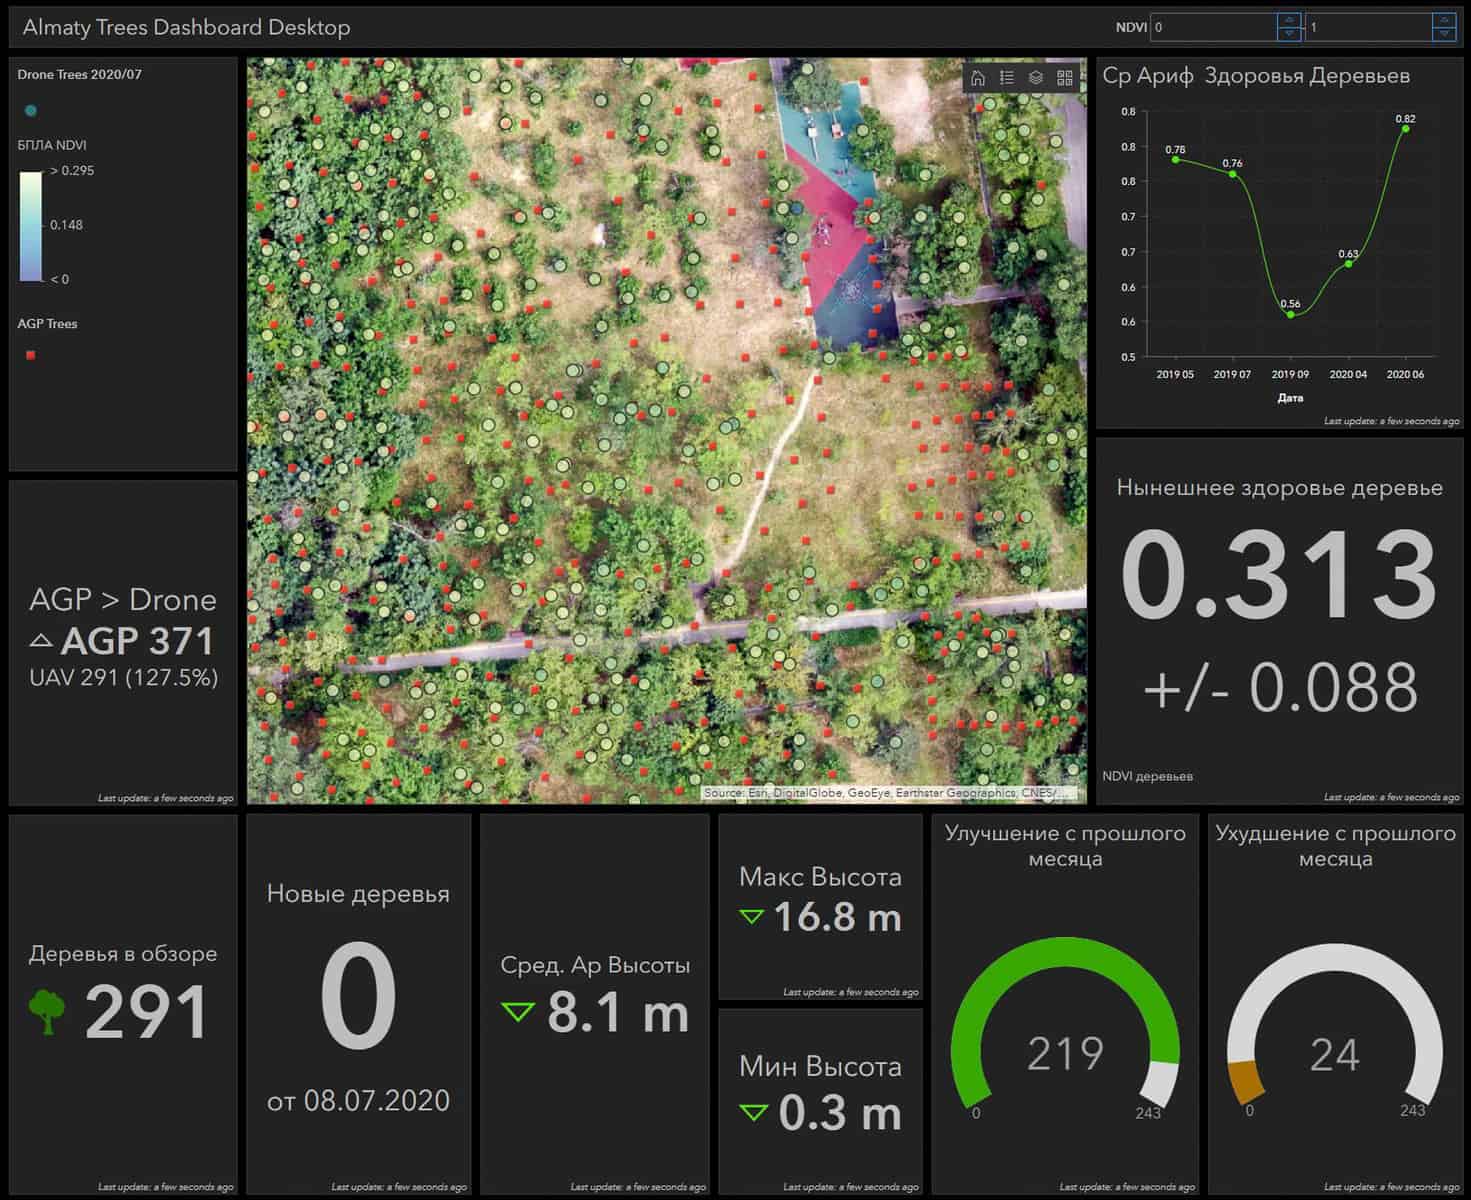
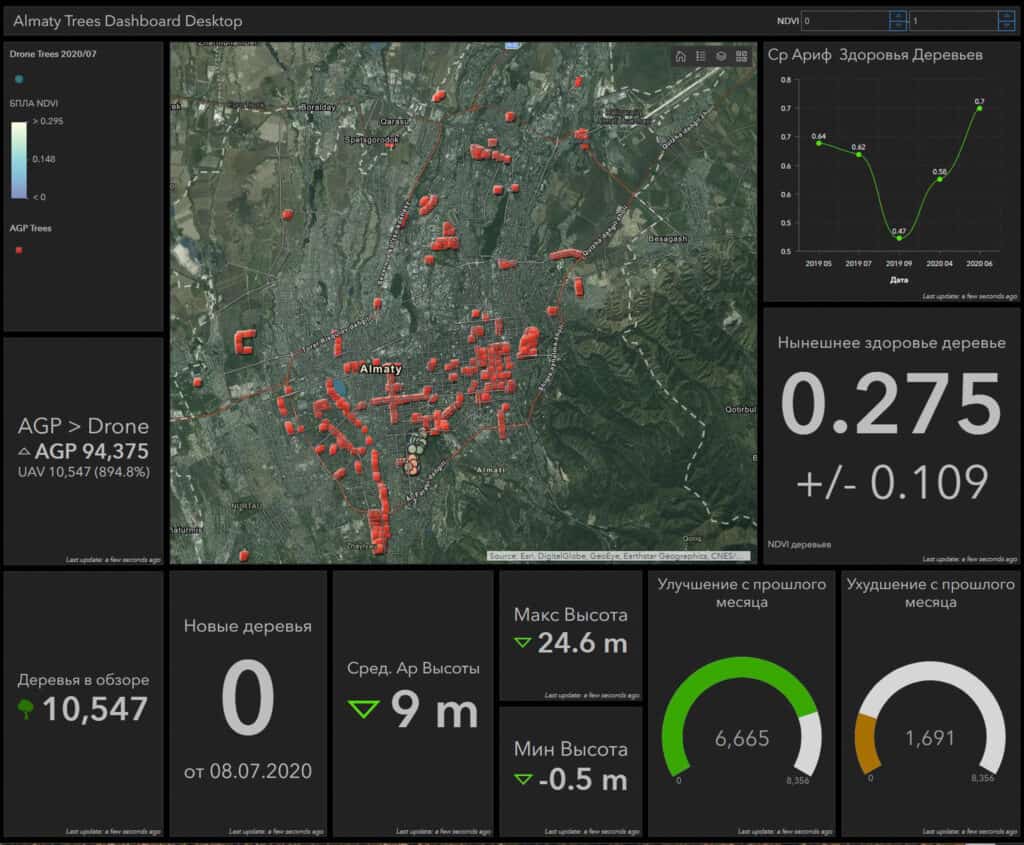
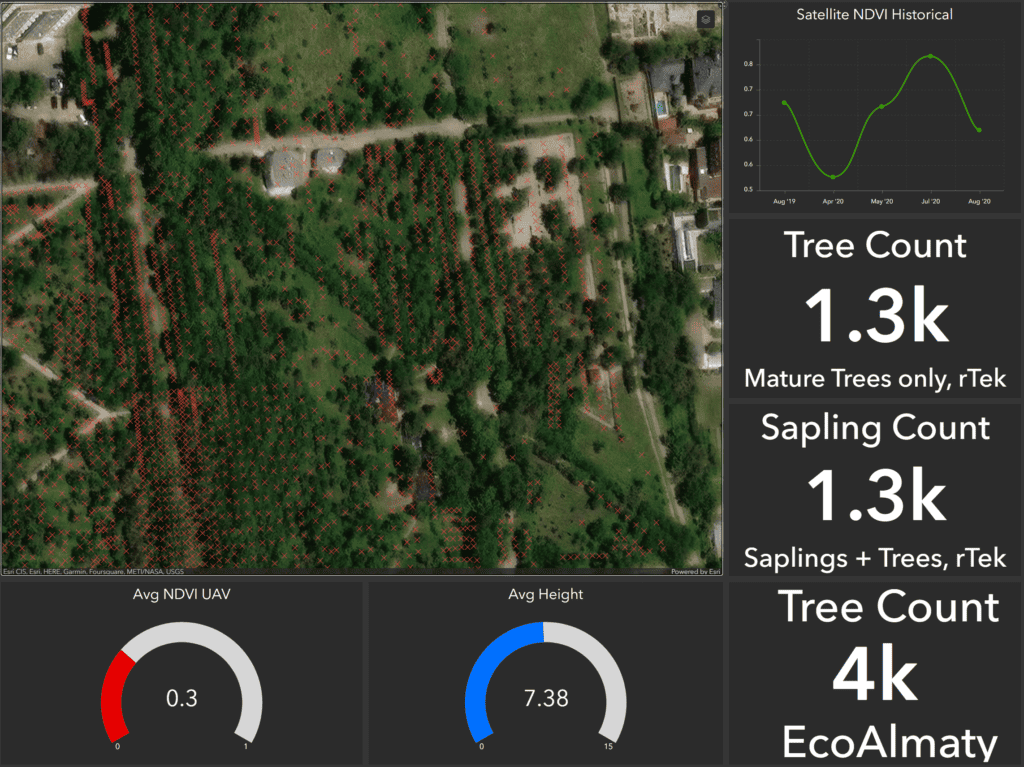
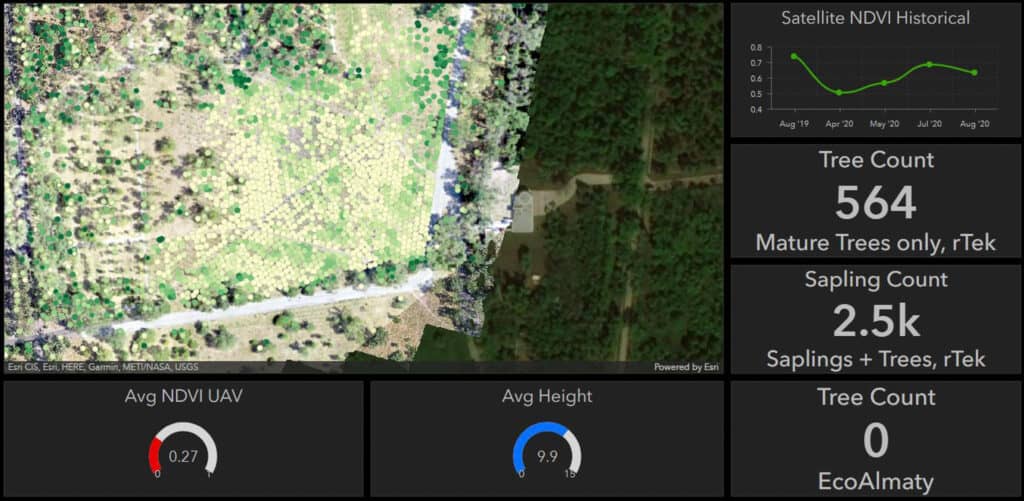
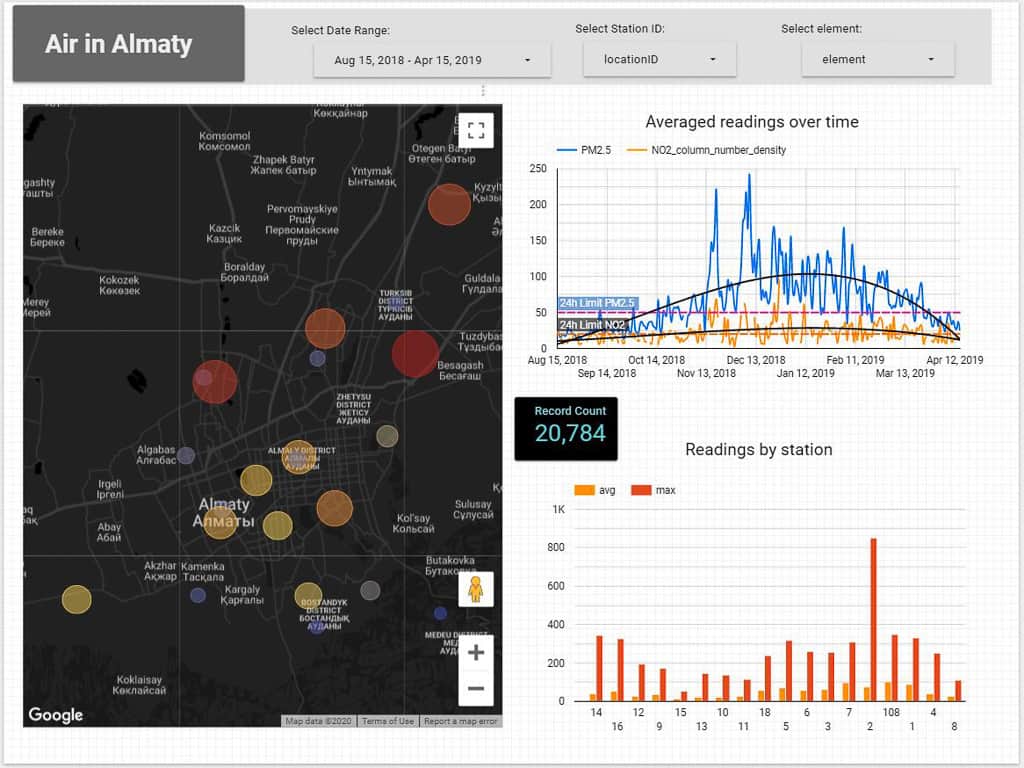
We want the data to be useful to inspectors, public people, and administrative stakeholders. For these purposes, we’ve created a number of dashboards to host the data, which you’ve seen throughout this article.
On one of the charts in the dashboard, we highlight our satellite data, which enriches every tree.
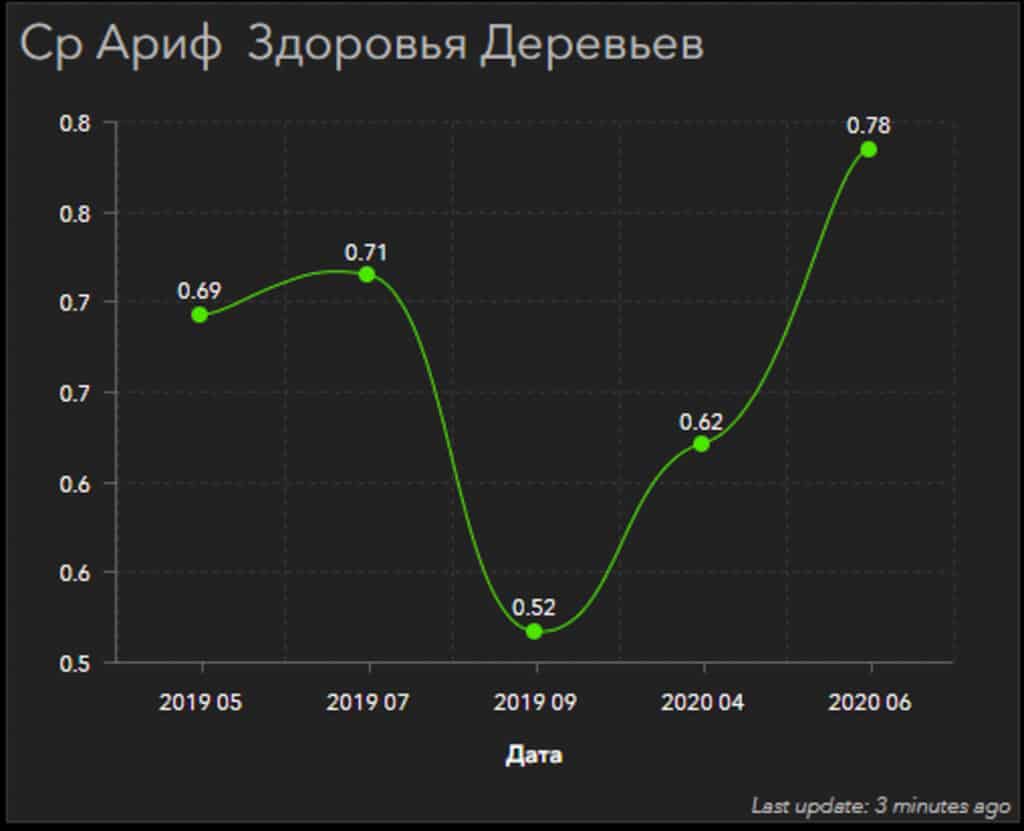
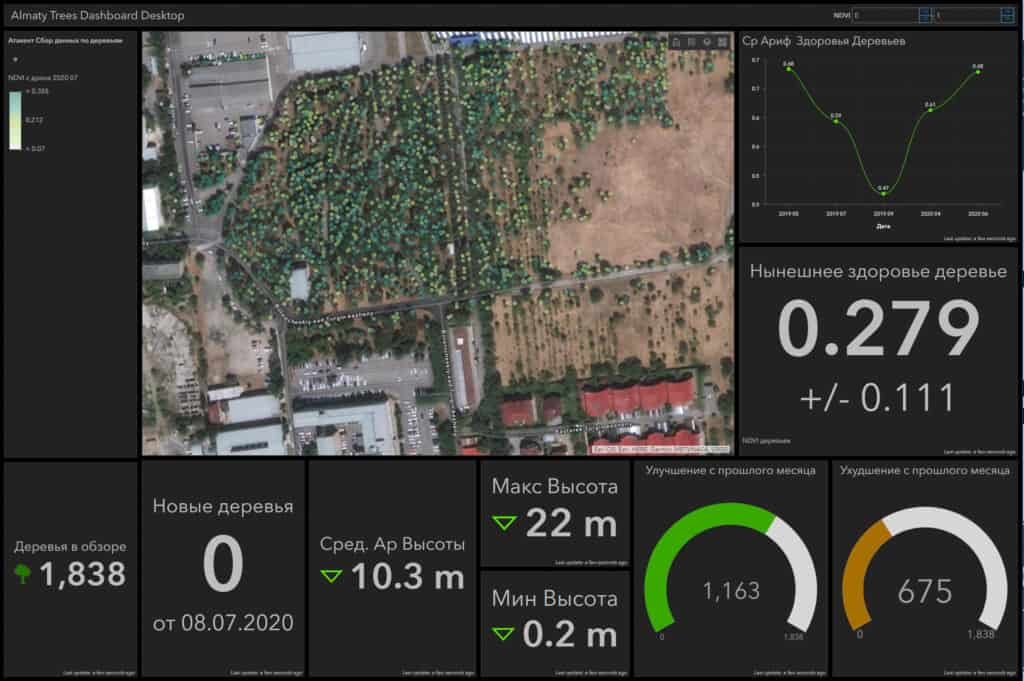
NDVI is computed each month, and applied as an attribute to all points, allowing statistics to be computed as the user pans the map. Statistics are bounded by the local region, allowing users to diagnose issue areas just by zooming in to the area of interest.
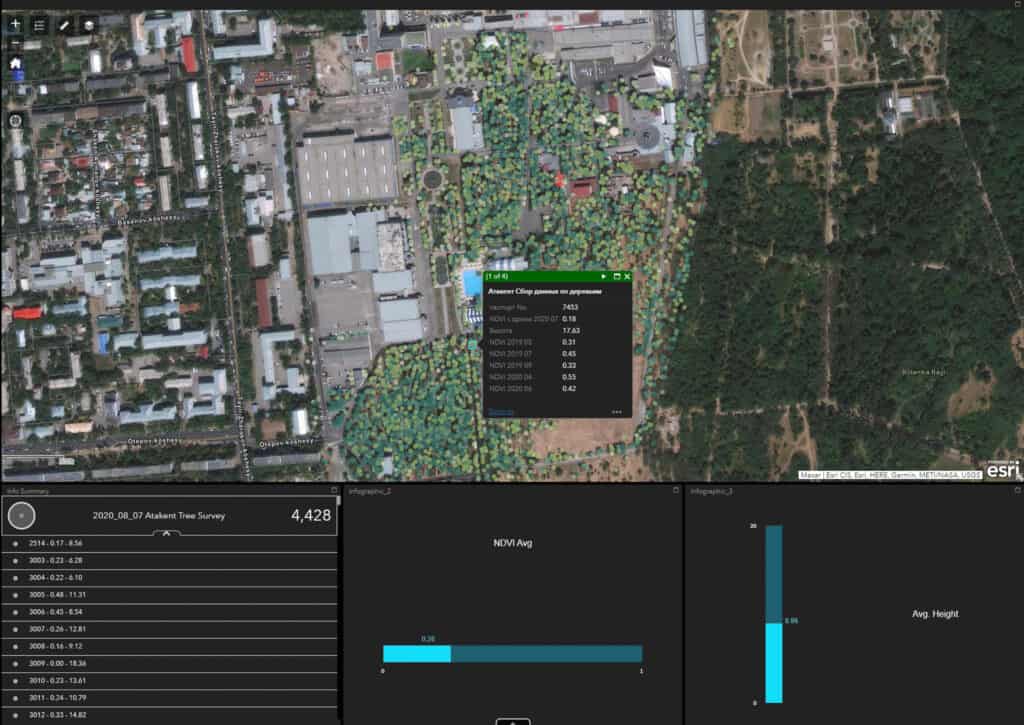
The most recent NDVI values are applied as a color ramp on the dots on the map. Lighter green towards yellow represents less healthy trees. Clusters of yellow trees in an otherwise dark green area are cause for concern.
Although trees may all appear healthy to the naked eye, NDVI (Normalized Difference Vegetation Index) levels drop when the photosynthesis activity of the tree begins to decline. This can be visible very early on, allowing the multispectral camera, which can see outside of the visible spectrum, to detect disease, pests, or irrigation issues earlier than a visual inspection.
NDVI stands for Normalized Difference Vegetation Index. It’s a way to measure how much vegetation there is in an area using satellite imagery. The formula for NDVI is (NIR – Red) / (NIR + Red), where NIR is the amount of near-infrared light reflected by vegetation, and Red is the amount of visible red light reflected by vegetation.
The resulting number tells us how much healthy vegetation is in an area, with higher numbers indicating more vegetation.
Inspectors can use this information to quickly identify zones where trees are threatened by lack of water, invasive species, or disease. Clusters of trees on the map that have stagnated growth or reduction of NDVI serve as early warning indicators.

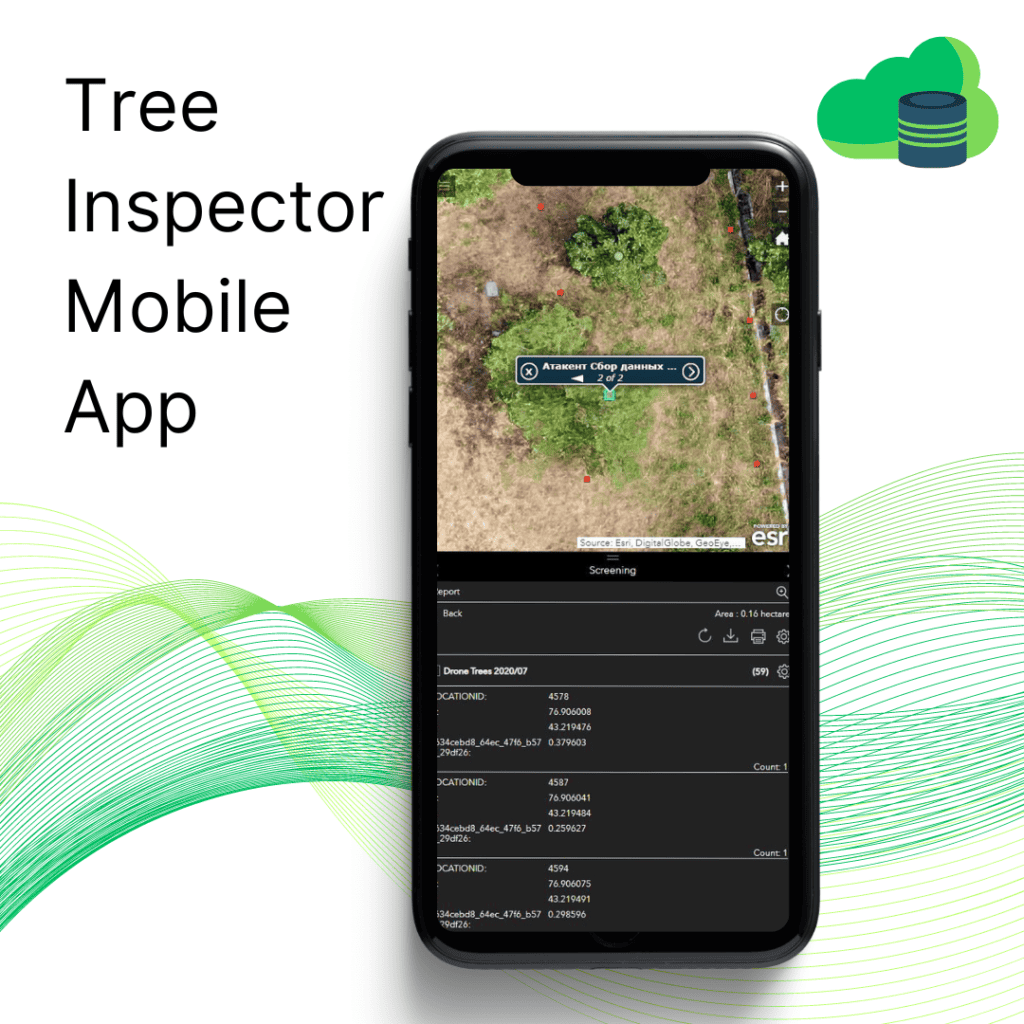
rTek has created handheld apps specifically for inspectors, to make the addition of field data easy. Inspectors can view the tree’s remote sensing data, and then make changes or add field data. The app uses on-device GPS so users can navigate to problem sections and visit individual trees using the map.
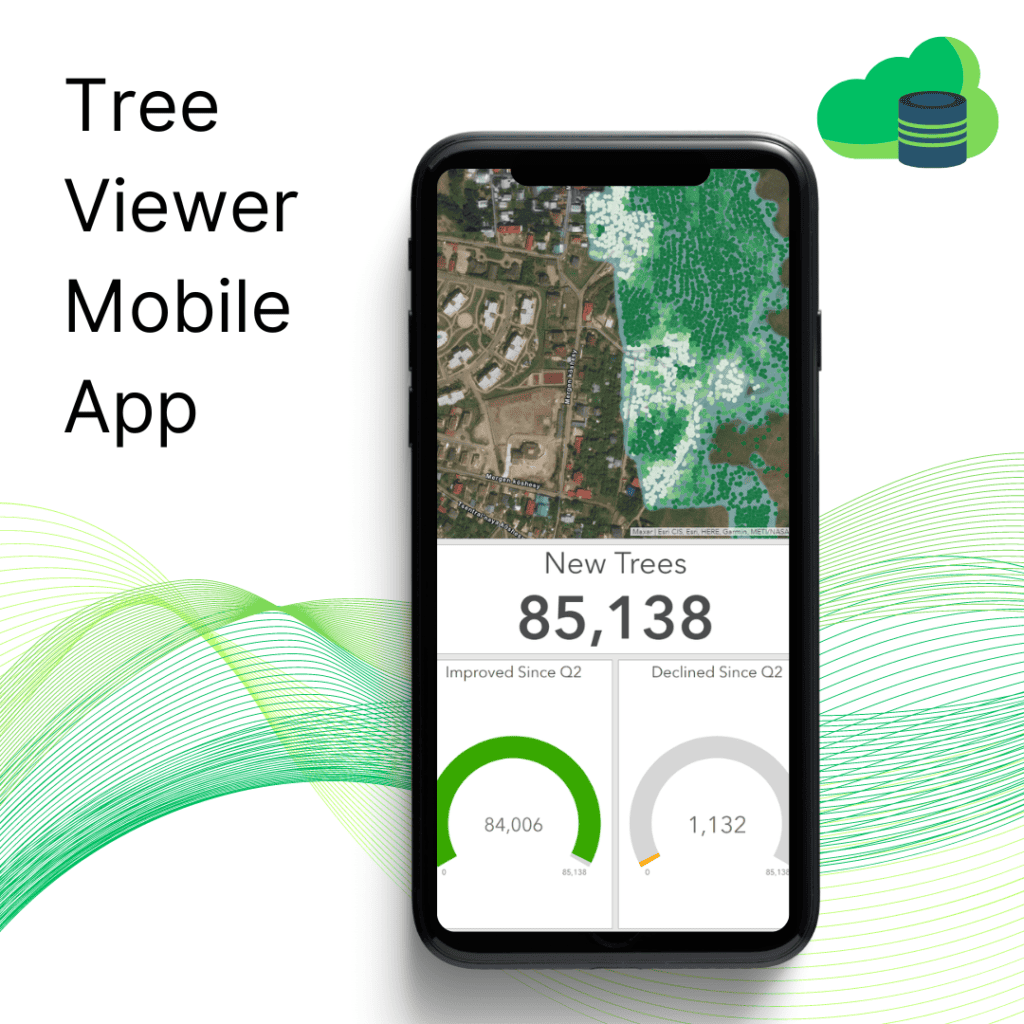
rTek has also created a mobile app for general users. Including the general public in urban greenery projects is one of our priorities, especially because of Almaty’s air pollution concerns.
The mobile app for general users allows them to view the data collected and learn more about the trees in their area. They can also report any issues or problems with specific trees, helping the city to maintain and improve its urban forestry. By engaging the public in this way, we hope to create a more connected and sustainable city.
Summary Findings
This case study explored the use of UAV imagery and algorithms to create a more accurate dataset for inventorying trees in urban environments.
The team at rTek found that the existing ground-based data had significant flaws, so we explored alternatives such as satellite data and LiDAR mapping. Ultimately, we used a combination of UAV multispectral imaging and algorithms to create a repeatable model for inventorying trees.
The resulting dataset was made available to inspectors and the general public through two mobile apps tailored to each user type and a desktop dashboard.
The team believes that this project demonstrates the strong potential of UAVs and common tree detection algorithms for urban forestry inventory as a commercialized and scalable solution.
Creating digital twins of trees in urban environments is quite straightforward. If UAV data is acquired over a short span of time, and advanced GIS systems are used, the digital twin creates a reference that all future project operations can be based on.
Finally, as public engagement and interest increase, rTek believes that UAV-based digital twins should without question be integrated as a cost-effective and accurate method for monitoring forestry projects in Kazakhstan.