UAV-borne LiDAR (Light Detection and Ranging) technology has emerged in the last 5 years as a force to be reckoned with. Precipitous drops in sensor costs and open-source software availability, driven in-part by the self-driving vehicle industry, have pushed LiDAR closer to the mainstream than ever before.
LiDAR is used in forest inventory to address several challenges. The main problem it aims to solve is accurately estimating the three-dimensional structure of forests, including tree height, canopy density, and biomass.
Compared to old LiDAR which was mounted on airplanes, UAV-borne LiDAR has delivered dramatically higher resolution in the last couple of years, unlocking super-accurate models of the forest. So accurate that we can confidently call them “Digital Twins.”
What is a Digital Twin?
A digital twin is a virtual representation or replica of a physical object, process, or system. It is created by collecting and integrating data from various sources such as sensors, machines, and other devices.
The digital twin provides real-time insights into the physical counterpart's performance, behavior, and condition, allowing for analysis, simulation, and optimization.
It can be used across various industries, including manufacturing, healthcare, transportation, and energy, to improve efficiency, productivity, and decision-making.
Before LiDAR, traditional forest inventory methods would rely on ground-based measurements or aerial photography, which can be time-consuming and limited in capturing detailed information about the forest structure.
And photogrammetry (taking measurements from aerial photos) has also been around for several decades. UAV-borne photogrammetry yields a very high resolution and enables a large amount of data to be collected about forests.
In the past, rTek collected urban forest inventory digital twins using only photogrammetry (see our case study here). Photogrammetry can yield some good data on tree locations, height, and health. Still, canopy density, DBH (diameter at breast height), and canopy volume are all very difficult to obtain with photogrammetry alone.
Height above terrain is also a difficult metric to understand with photogrammetry. Obtaining a terrain model can be impossible in dense forestry areas where the ground is not visible, which can dramatically decrease forest inventory and biomass estimates.
Enter UAV-based LiDAR.
LiDAR overcomes these limitations by using laser pulses to measure the distance between the sensor and the objects in the forest, creating highly accurate and detailed 3D vegetation models.
The laser beams can penetrate tiny openings between leaves, allowing modeling of the ground even in the most dense forests. (By the way, this is the very same tech that archaeologists use to discover new ruins beneath the jungles of Central America).
This rich data helps assess forest health, monitor changes over time, plan sustainable forestry practices, and estimate carbon stocks.
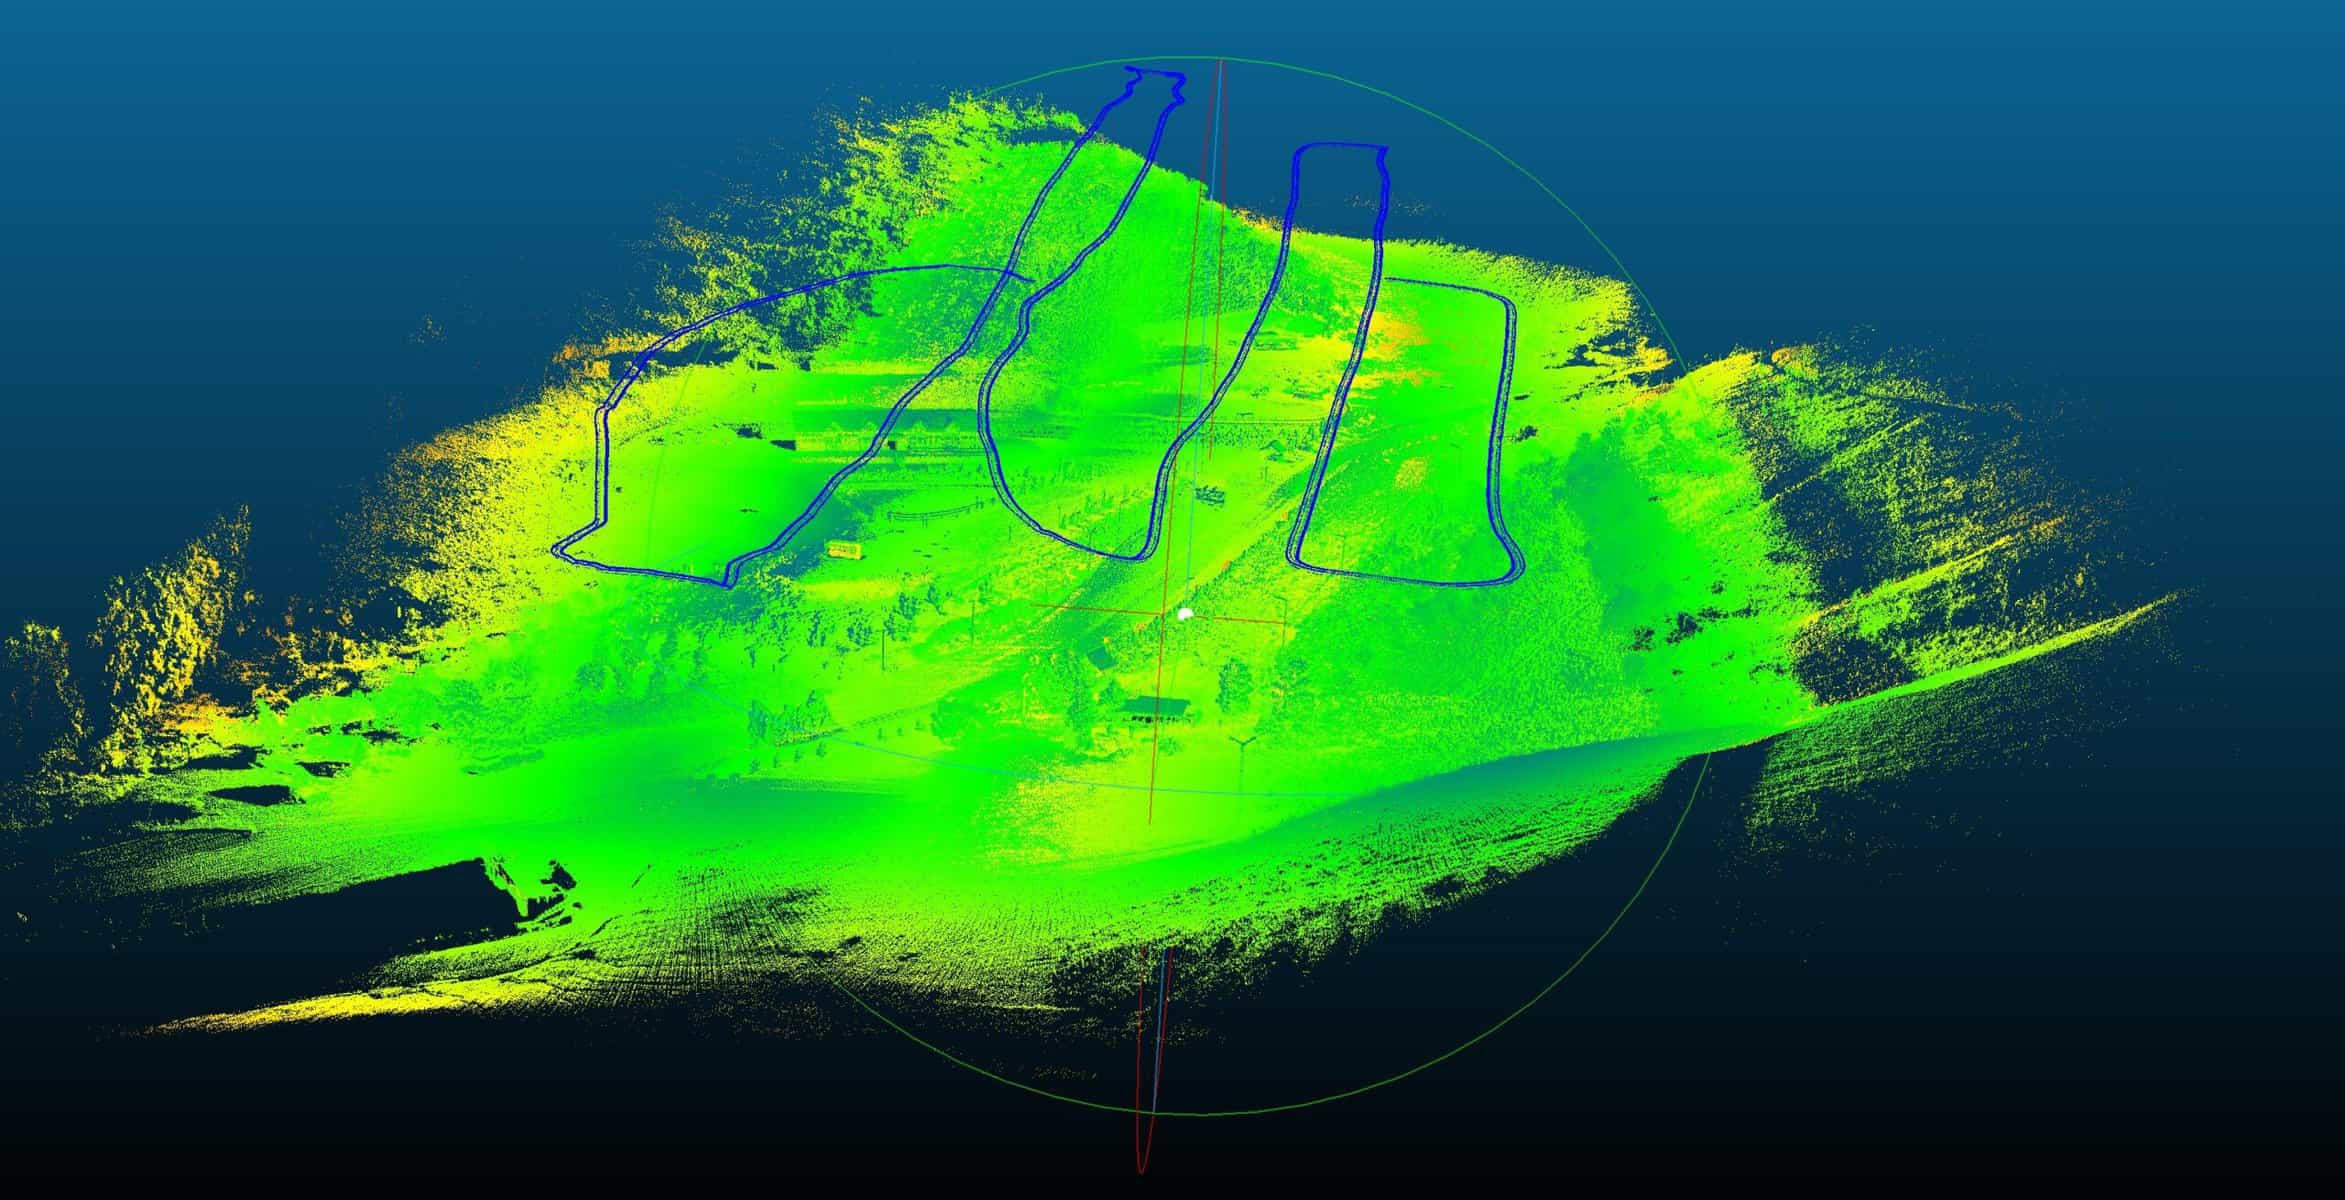
In this case study, rTek captures a LiDAR-based digital twin at a popular ski resort in Almaty. We’ll explore LiDAR applications in forestry and demonstrate how incredibly accurate and valuable these forest digital twins can be.
What is LiDAR?
LiDAR, which stands for Light Detection and Ranging, is a remote sensing technology that uses laser pulses to measure distances and create highly accurate 3D representations of the Earth’s surface.
In the context of forest inventory and UAV-based acquisition techniques, LiDAR is used to gather detailed information about the structure and composition of forests.
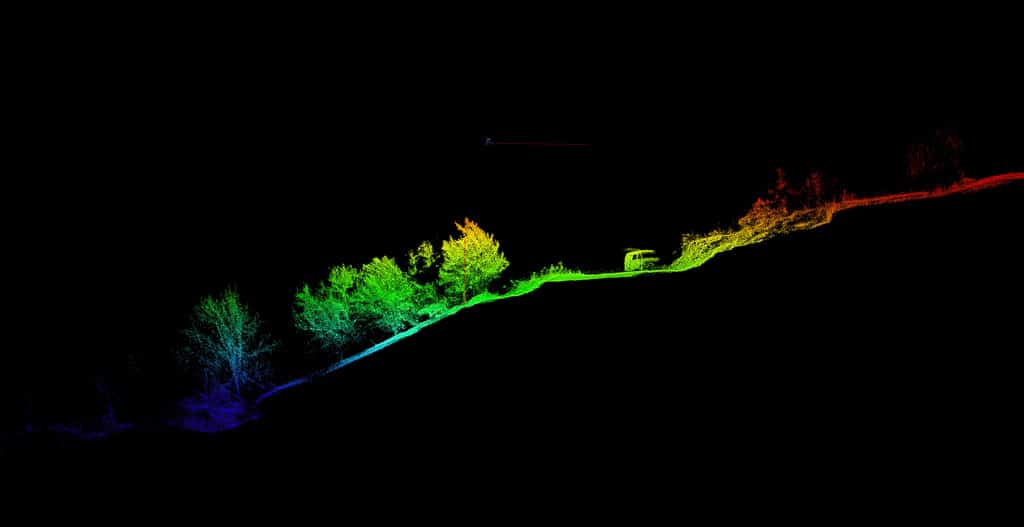
LiDAR systems mounted on drones can capture high-resolution data by emitting laser beams toward the ground and measuring the time it takes for the light to return after hitting an object. This data is then used to generate precise digital elevation models (DEMs) and point clouds, which provide information about the height, density, and distribution of objects within an area.
Using LiDAR in forest inventory and UAV-based acquisition techniques, researchers and forest managers can obtain valuable insights into various forest attributes, such as tree height, canopy cover, biomass estimation, and species classification. This information aids in monitoring forest health, assessing carbon stocks, planning timber harvesting operations, and conducting ecological research.
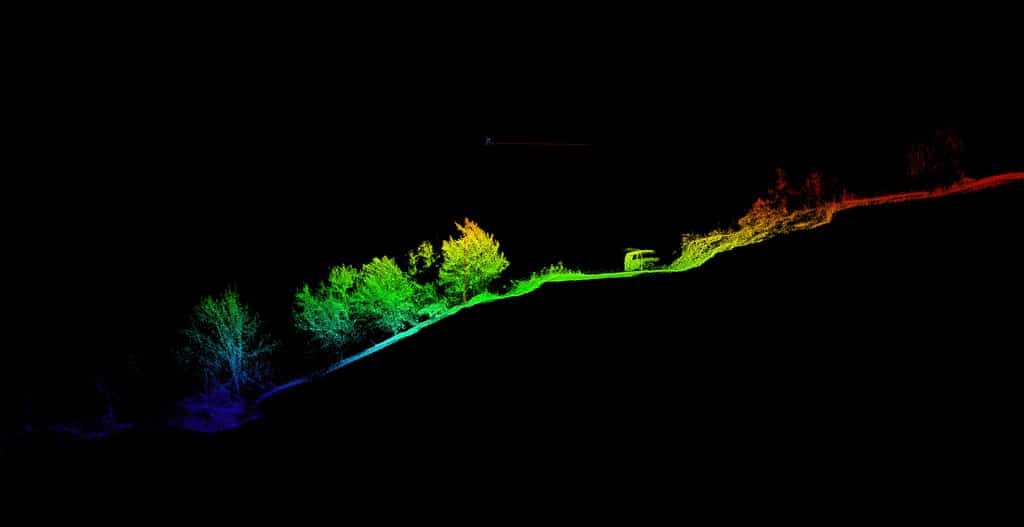
LiDAR sensors create point clouds- essentially 3D models of the environment, down to a centimeter-scale.
In such high resolution, point clouds contain a wealth of information that can be extracted for many forestry applications. Let’s look at some of the potential uses of this incredibly complex data.
Precise Afforestation Baseline and Stock Monitoring
Before starting any ARR (afforestation, reforestation, or revegetation) project, you need to understand and quantify the baseline. Then, you need to monitor the effects of your project’s changes (hopefully improvements) on the vegetation state of your site.
Baseline: think of it as the "before" measurement.
In the context of Afforestation and Reforestation (ARR), the "Baseline" refers to the reference level of greenhouse gas emissions or removals that would occur in the absence of an ARR project.
It represents the estimated emissions or removals that would occur from the same area if no afforestation or reforestation activities were implemented.
The baseline is used as a benchmark to assess the additional climate benefits achieved by the ARR project, by comparing the actual emissions or removals with what would have happened without the project.
LiDAR helps to produce a precise model of where trees are, where they aren’t, and what condition they are in. Even burned or degraded areas still have significant standing biomass, which LiDAR can quantify.
Later in forest development, LiDAR technology can be crucial in modeling biomass stocks with a high spatial and temporal resolution. This is helpful for carbon sequestration efforts, such as afforestation programs.
Afforestation isn’t successful if trees were planted but later die off. By using LiDAR, foresters can analyze individual branches on trees and identify differences over weeks or months, not years, producing an early warning of issues in developing forests.
Let’s take a look at some specific aspects of LiDAR that make it so useful for afforestation:
1. The Entire Forest Structure is Captured.
The high-fidelity forest structure itself is the crucial baseline data that yields many other insights.
LiDAR uses laser pulses to measure the distance between the sensor and objects on the ground, including trees and vegetation.
By capturing millions of these data points, LiDAR provides highly accurate measurements of forest structure, including tree height, canopy density, and vertical distribution of biomass. This information is essential for estimating forest biomass stocks- rTek’s end goal with this case study.
2. UAV-LiDAR’s High Spatial Resolution is Game-Changing.
UAV-LiDAR generates detailed three-dimensional point clouds with an accuracy of around 5 centimeters. That level of detail captures dense vertical structures of forests, like leaves, branches, trunks, and undergrowth.
This allows for precise identification and delineation of individual trees, enabling accurate biomass estimation. The ability to capture fine-scale variations in forest structure is particularly valuable when modeling biomass stocks in heterogeneous landscapes, like the one we’ve captured in our case study.
3. High Observation Frequency (Temporal Resolution) Unlocks New Insights.
UAV LiDAR is quite nimble compared to its aircraft counterpart. It can be used for quick repeated surveys over time, allowing for the monitoring of changes in forest biomass stocks.
By comparing multiple LiDAR datasets acquired at different time intervals, it becomes possible to assess the growth rates and carbon sequestration potential of forests.
This temporal resolution can make a dramatic difference in evaluating the effectiveness of afforestation efforts and guiding management strategies.
4. Non-Destructive Data Collection
UAV LiDAR is a remote sensing technique that does not require physical contact with the forest.
This non-destructive nature makes it ideal for large-scale assessments of forest biomass stocks without causing any harm to the ecosystem. It also enables the collection of data in challenging or inaccessible terrain, ensuring comprehensive coverage of forested areas.
5. Integration with Other Data Sources
LiDAR data can be combined with other geospatial datasets, such as satellite imagery and ground-based measurements, to enhance the accuracy and reliability of forest biomass models.
By integrating LiDAR-derived forest structure information with spectral data from satellites or ground-based inventories, researchers can improve the estimation of biomass stocks and carbon sequestration potential.
But why is it important to measure a forest? In this case study, our client wanted to test a few construction scenarios for a new ski lift. Reducing the number of trees that need to be cut down is practical- it saves a lot of money in construction costs.
There are a number of other reasons why you might want to measure the forest with LiDAR, however. For example, for forest fire prevention or mitigation, or for carbon sequestration efforts.
Preventing Forest Fires
LiDAR-based Forest inventory plays a crucial role in preventing fires by providing valuable information through fuel modeling, canopy bulk density, crown cover, and vertical structure.
This data helps identify areas prone to fire risks, such as dense canopies, ladder fuels, and areas with accumulated dead biomass.
Let’s explore how accurate forest inventory can contribute to fire prevention.
1. Fuel Modeling
Fire behavior requires an understanding of the location, amount, and type of fuel in a forest. UAV LiDAR enables very high-resolution mapping of forest fuels, not previously achievable through airborne LiDAR (aircraft-mounted) or remote sensing.
By accurately measuring the amount of dead and live vegetation, including trees, shrubs, and ground fuels, forest managers can develop fuel models that estimate the potential fire behavior and spread.
This information is vital for planning prescribed burns, implementing fuel reduction treatments, and predicting fire behavior during wildfire events.
2. Canopy Bulk Density
Canopy bulk density refers to the amount of foliage and branches present in the forest canopy. Forest inventory techniques combined with LiDAR can provide precise measurements of canopy structure and density.
High canopy bulk density indicates a dense forest with increased fuel loads, which can facilitate the rapid spread of wildfires.
By identifying areas with high canopy bulk density, forest managers can prioritize fuel reduction treatments like thinning or pruning to reduce the risk of fire ignition and spread.
3. Fire Behavior Prediction
Accurate forest inventory data, including fuel models, canopy bulk density, and LiDAR-derived measurements, can be used in fire behavior prediction models.
These models simulate how fires might behave under different weather conditions, topography, and fuel characteristics.
By inputting precise forest inventory data into these models, fire managers can make informed decisions about fire suppression strategies, resource allocation, and evacuation planning.
4. Early Detection and Monitoring
The high temporal and spatial resolution forest inventory that UAV-LiDAR provides, combined with ongoing monitoring efforts, is a key enabler in the early detection of changes in forest conditions that may increase fire risks.
By regularly updating forest inventory data, forest managers can identify areas where fuel loads have increased due to insect infestations, disease outbreaks, or drought-induced mortality. This information allows for targeted management actions, such as removing dead trees or implementing prescribed burns, to mitigate fire risks before they escalate.
Accurate forest inventory, including fuel modeling, canopy bulk density assessment, and the integration of LiDAR technology, provides critical information for preventing fires.
By understanding the fuel characteristics and structure of forests, fire managers can implement proactive measures to reduce fire risks, plan effective fire suppression strategies, and make informed decisions to protect both human communities and valuable forest resources.
rTek’s Solution
Now that the potential problems solved are identified let’s look at the solution that rTek explored.
We ultimately wanted to understand the amount of biomass and number of trees in the target area, which contained multiple potential ski-lift base locations.
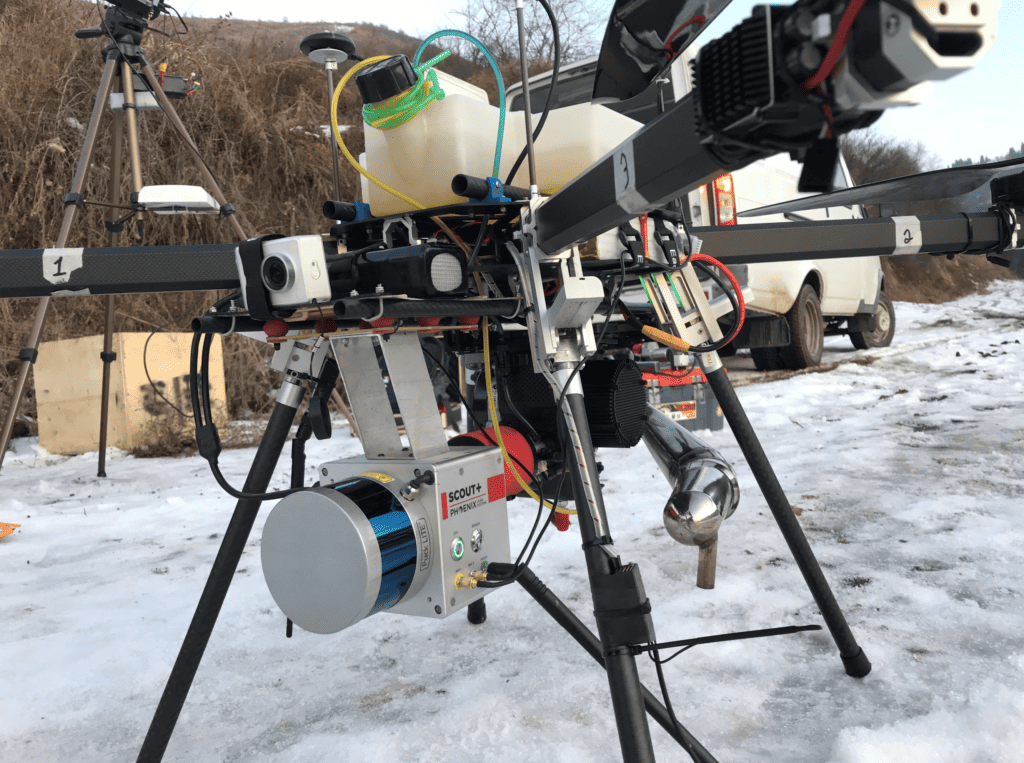
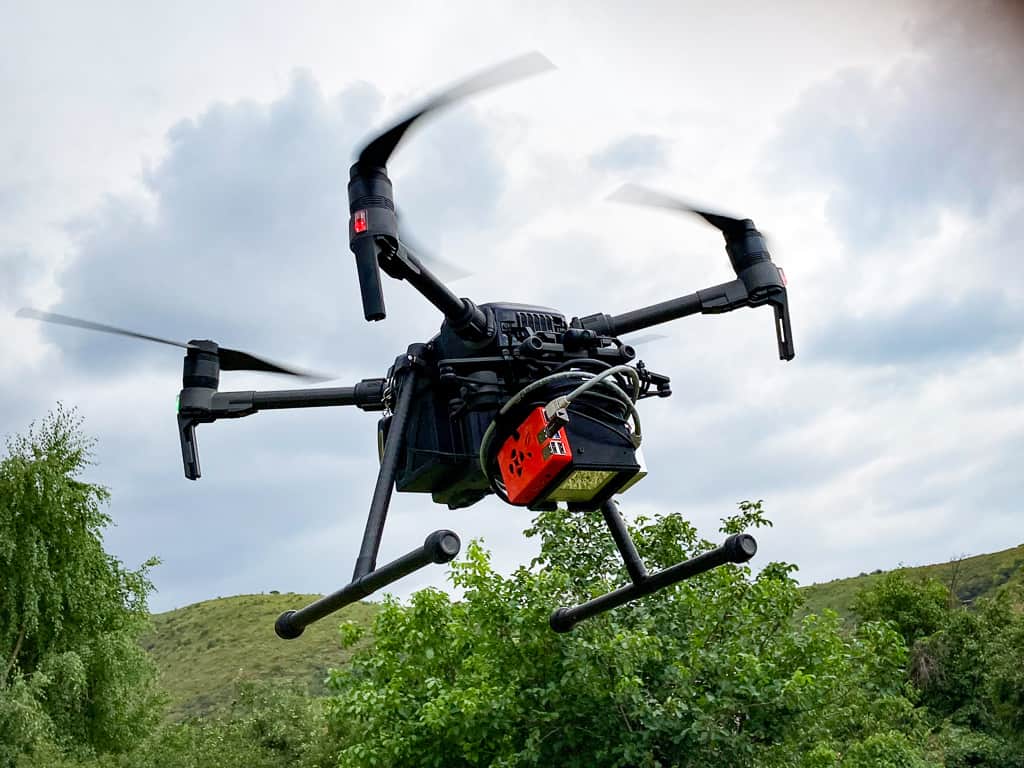
For this case study, rTek used the Scout-16 from Phoenix LiDAR Systems, mounted on a custom-designed hybrid gas/electric quad-copter, with over 2h of potential flight endurance.
Setting up the LiDAR Unit
First, we needed to check our system’s accuracy.
rTek designed and built the UAV, dubbed “superdrone,” and integrated the Phoenix Scout-16 with RTK antennas, including boresight calibration of the LiDAR and precise setup of the mounting parameters.
The UAV was custom engineered in a collaboration between rTek and Adrome Automation. It’s designed to hold a large payload for an extended endurance mission at high altitudes above 2000m.
It uses a micro-scale high-output gas generator and a small battery pack to create a hybrid power system, enabling up to 6h of flight time with no payload. We tested many prop configurations as well to enable high-altitude flight with heavy payloads. We might get more into it in another case study, but suffice to say, it was a significant engineering task on its own.
The IMU in the Scout-16 arrived wiped of factory settings, so we spent a fair bit of effort understanding how to enter the distance offsets and angular offsets into the laser configuration.
Every IMU is different, and the Scout-16’s unit required an alpha, beta, and gamma correction (Euler angles or rotational offsets about the x, y, and z-axis), for which two values would only accept negative degrees for some reason. We never figured out why, but once we had the correct rotation values, we screenshot them, wrote them down in multiple places, etc.
Folks – I can not emphasize this enough – don’t ever clear your IMU factory settings. It’s not something we want to deal with when we’re on the other side of the planet from the manufacturer.
Anyway, once the laser was firing properly, we could visualize the point cloud in the ground station software and see that it was mapping the 3D space around us.
We used the LiDAR unit hand-held and “mapped” a GCP (ground control point). In this case, it was a ladder with a known height and some objects on the ground that we had measured beforehand.
After processing, we knew the local measurements were accurate, so we explored field measurements using the GNSS (Global Navigation Satellite System) unit.
Setting up the GNSS
From our experience in geodetic accuracy photogrammetric surveys, we knew a very high accuracy correction would be needed for the GNSS.
The Scout-16 has two GNSS antennas, connects to all four major constellations (The US’s-GPS, China-BeiDou, EU-Galileo, and Russia’s GLONASS), plus SBAS (the Satellite-Based Augmentation System). The unit can connect to ground-based augmentation like WAAS in the US, but there isn’t a ground-based GNSS augmentation system in Kazakhstan.
Even with all of these connections (up to 35-40 satellites at once), the GNSS accuracy is only around 3m. That is, before we add kinematic corrections.
What are Kinematic Corrections?
Kinematic GNSS corrections refer to the real-time correction data that is used to improve the accuracy of Global Navigation Satellite System (GNSS) positioning in dynamic or moving applications.
When using GNSS for positioning, such as in surveying or navigation, the signals from multiple satellites are received by a receiver on the ground or in a moving vehicle. However, various factors like atmospheric conditions and satellite clock errors can introduce errors in the position calculations.
To mitigate these errors, kinematic GNSS corrections are applied. These corrections provide information about the errors in the GNSS signals and help refine the position calculations. They are typically provided by a reference station or a network of reference stations that have known positions and accurately measure the GNSS signals.
The kinematic GNSS corrections include information about satellite orbits, clock errors, ionospheric delays, and other error sources. This data is transmitted in real-time to the GNSS receiver, which then applies the corrections to improve the accuracy of the calculated position.
By using kinematic GNSS corrections, users can achieve centimeter-level positioning accuracy in real-time, making it suitable for applications like precision agriculture, autonomous vehicles, and surveying.
Two types of kinematic corrections can be used in this scenario- RTK (real-time), and PPK (post-processed). We used a combination of both to evaluate which workflow worked best.
In PPK or RTK corrections workflows, you must establish another GNSS antenna (usually a much larger, higher gain antenna) to record the corrections data. This can be accomplished in many different ways:
A CORS (Continuously Operating Reference Station) Network: There’s Leica Smartnet in Kazakhstan. The closest station is about 15 km away from our site. The minimum error is about 3 cm absolute and 1.5 cm relative, degrading at 1 mm/km of baseline. So we’re looking at 4.5 cm of GNSS error overall for our location. Not bad, but our clients asked for the maximum accuracy possible.
What is Baseline?
Baseline in GNSS terminology (Global Navigation Satellite System) refers to the distance between two or more receivers that are used to measure and calculate precise positioning information.
It is the vector connecting two receiver antennas, typically measured in three-dimensional space (latitude, longitude, and altitude).
The baseline is a fundamental parameter in GNSS applications such as surveying, geodesy, and navigation, as it provides the basis for determining accurate positions and distances.
Corrections technologies like RTK and PPK assume that Rover and Base station are close together and that the corrections data is valid for the Rover. But when the rover is further away, the corrections data becomes less relevant (like how a weather forecast for the airport might not be relevant for someone living on the other side of the city).
For these reasons, baselines should be minimized as much as possible.
On-site reference station: Setting up an on-site reference station allows you to create your own CORS for the duration of your flight without the baseline error. You can feed the kinematic corrections data into the rover GNSS on the UAV in real-time or save it in a RINEX file and use it later for PPK.
We tried both options.
However, no known coordinates existed at the site. Even worse, the Leica CORS station didn’t have known coordinates either. So for both, we needed to use yet another GNSS processing technology, PPP.
PPP allows you to observe (collect raw GNSS signal data) at a fixed location, typically for around 3 hours, and then submit the data to a global modeling system. The modeling system (similar to a global weather model, but for ionospheric distortion) will then output the coordinates and error of that fixed point.
After that, we could set up our GNSS base station on the point, enter the coordinates, and begin sending corrections.
Collecting the Data
Once we had GNSS set up, we collected the LiDAR data. This was probably the shortest part of the entire work, taking only around half an hour. But even with high-precision GNSS, LiDAR data isn’t exactly useable on its own. Several other sources of error need to be removed before the LiDAR point cloud can be used.
In this case study, we identified 3 major areas of error in the raw point cloud: IMU roll error (also called overlap), noise, and heading error.
Heading Error
Heading error is perhaps the easiest type of error to remove in an IMU. A specific flight pattern is flown, before and after the flight, to help establish the compass drift. It might look familiar.
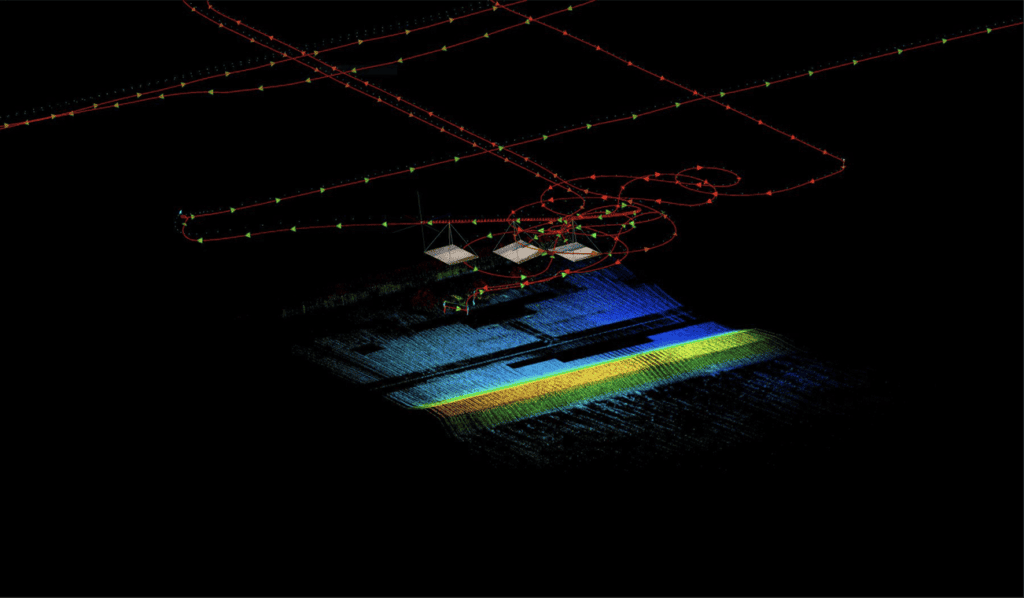
It’s a figure-eight, just like you might be familiar with if you’ve ever used the compass app on your phone. When we fly the figure-eight, the 3D magnetometer units in the IMU collect magnetic field strength from the entire sphere and attempt to cancel out interactions with the UAV itself.
Heading error can be calculated by flying a couple of figure eights before and after a flight. Then, we run a tool called trajectory post-processing, that applies an interpolated adjustment to the entire flight line throughout the mission.
Throughout our flights, the IMU heading drift was around a tenth of a degree. At 50-75 meters radially from the sensor, that can translate to nearly half a meter, so it’s very important that we cancel it out.
Roll Error
Roll error is quite difficult to remove. It happens when acceleration forces on the aircraft reduce the accelerometers’ ability to sense gravity’s pull downward and begin to drift. There are a couple of steps we took to mitigate this.
First, we performed static calibration. Before and after each flight, we let the IMU “warm up” and “cool down” for 15 minutes. During this time, it should be completely still. A similar correction is applied during trajectory post-processing to remove any drift.
Secondly, we designed mounts made from 3D-printed TPU (thermal polyurethane) that damp vibration coming from the gasoline engine. The high-frequency vibration is much more difficult for the Kalman filter on the IMU to cancel out, so we decided to try to lower the frequency by mounting the LiDAR via rubber mounts. After trial and error, we eventually found the required stiffness of dampers, and reduced the IMU noise enough so that drift was not an issue.
Noise
Noise is present in any point cloud – where the detector identifies a gets a laser pulse return that doesn’t exist in real life. We noticed increased noise when flying in smoky or hazy conditions and when snow was on the ground (snow drift kicks up in the wind and tiny particles reflect the laser in the air).
To mitigate these issues, we flew in overcast, clear air when possible and had a hard limit on the wind since the snow was on the ground during our flights. Airborne snow reflections were also much less severe immediately after or during a warm day since the surface likely had melted slightly, and the chance for powder to catch flight was much lower.
Lastly, we used machine learning classification of the point cloud to remove noise as an experiment. We’d recommend it as a last resort only, however, and not rely on auto classifiers to remove noise, as they are often only 50/50 accurate and could easily be misclassifying and deleting real points.
Finally, once we had an acceptable point cloud, we first started extracting the “easy” derivatives before moving on to trying to model the trees.
Helpful GIS Outputs
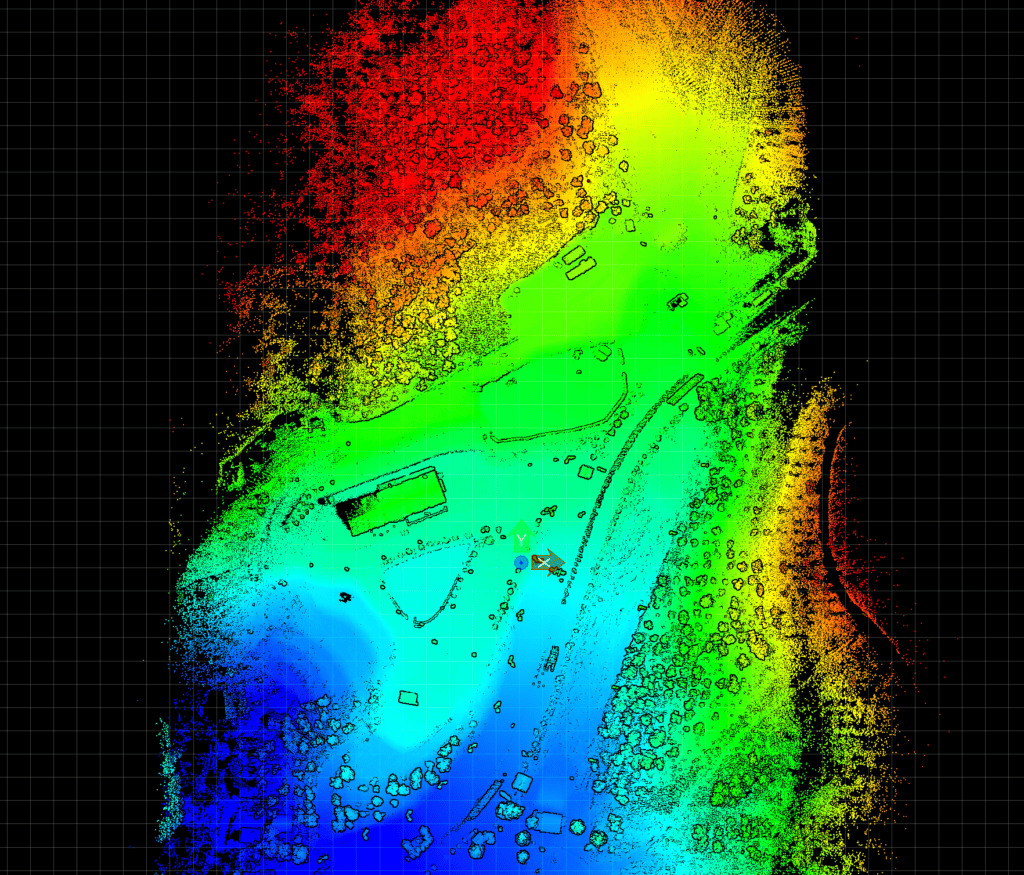
LiDAR point clouds, especially ones of mixed-use sites with geodesic accuracy, include a wealth of information about the landscape. This high-resolution data that can be used to generate various GIS outputs. Some of the commonly obtained LiDAR-derived outputs include:
Digital Terrain Model (DTM): A DTM represents the bare earth surface by removing vegetation and man-made structures. It is useful for construction projects, land management, flood modeling, and agriculture planning.
Digital Surface Model (DSM): A DSM includes all above-ground features like buildings, trees, and other structures. It helps in urban planning, forestry analysis, and visualizations.
Canopy Height Model (CHM): CHM represents the height of vegetation or tree canopy above the ground. It is valuable for forest inventory, habitat assessment, and urban green space planning.
Slope and Aspect Maps: These maps provide information about the steepness (slope) and orientation (aspect) of the terrain. They are useful for identifying suitable locations for infrastructure development, road design, and erosion control.
Hillshade Models: Hillshade models simulate the shading effects of sunlight on the terrain, creating a visually appealing representation. They are often used for cartographic purposes, visualization, and landscape analysis.
Contour Lines: Contour lines represent lines of equal elevation on a map. They are widely used in engineering, surveying, and land development projects to understand the topography and plan infrastructure.
Floodplain Mapping: LiDAR data can help identify flood-prone areas by analyzing elevation differences and hydrological patterns. This information is crucial for flood risk assessment, emergency management, and insurance purposes.
Line-of-Sight Analysis: By considering the elevation data from LiDAR, line-of-sight analysis can be performed to determine visibility between different points. This is beneficial for siting communication towers, surveillance systems, and optimizing viewsheds.
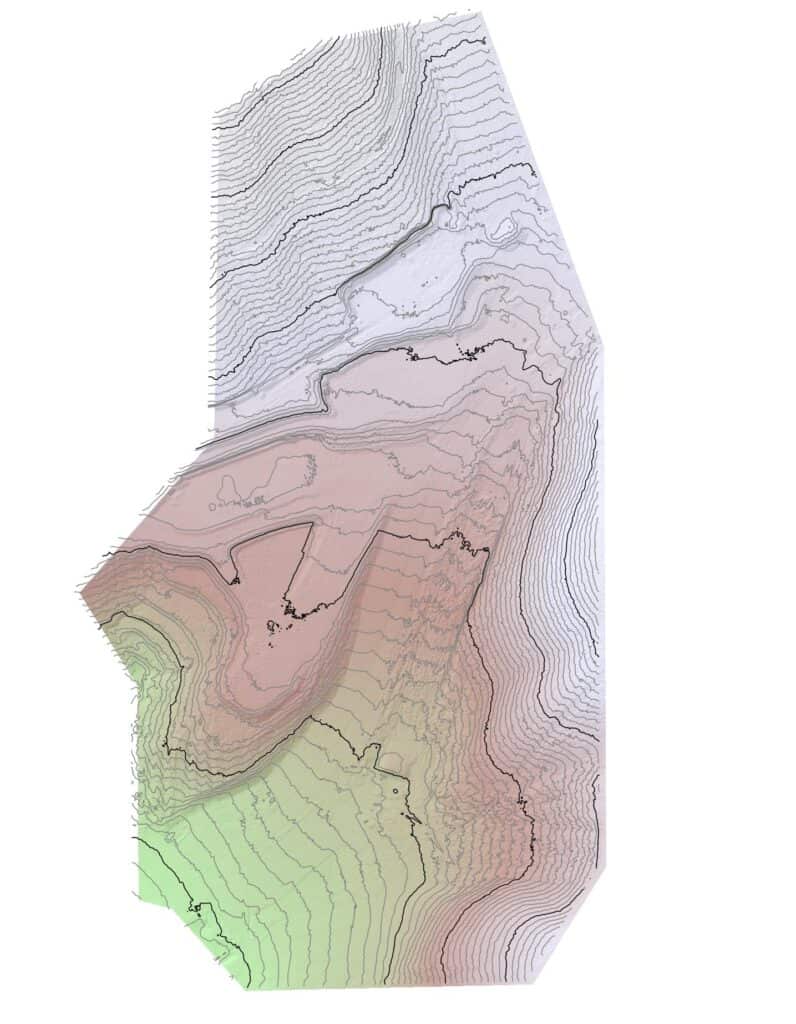
Topographic maps like the one above combine many LiDAR derivatives into one visualization, allowing intuitive planning and site scenario tests.
Because LiDAR laser pulses can pierce through dense foliage and easily detect the ground beneath trees, the topographic data is much more detailed than traditional surveys. We’ll use this detail next to increase our above-ground mapping accuracy.
These are just a few examples of the GIS outputs that can be obtained using LiDAR data.
For example, many pre-trained auto classifiers exist for LiDAR point cloud data, which can segment objects by type. Roads, powerlines, vehicles, pipes, cars, and even underwater objects (in the case of bathymetric LiDAR) can be detected automatically using machine learning.
The applications of LiDAR in construction, agriculture, and other industries are vast, providing valuable insights for planning, analysis, and decision-making processes.
Counting Trees
We performed a series of general point cloud auto classifications using algorithms from Green Valley Intl., TerraSolid, Bentley, Pix4D, and Agisoft. When classifying land use type (road, low vegetation, car, building, high vegetation, water, tree, etc.), each tool was generally able to classify points within a reasonable range, however, manual re-classification was always required.
When initially performing point classification, every point is separated by type. We’ve separated trees from low vegetation and ground in the image below. This initial classification is performed by a simple difference model (height above ground points).
Ground points are segmented as the lowest points that aren’t noise. Then items above a certain height from these ground points are considered trees. Everything in-between is considered “Vegetation.”
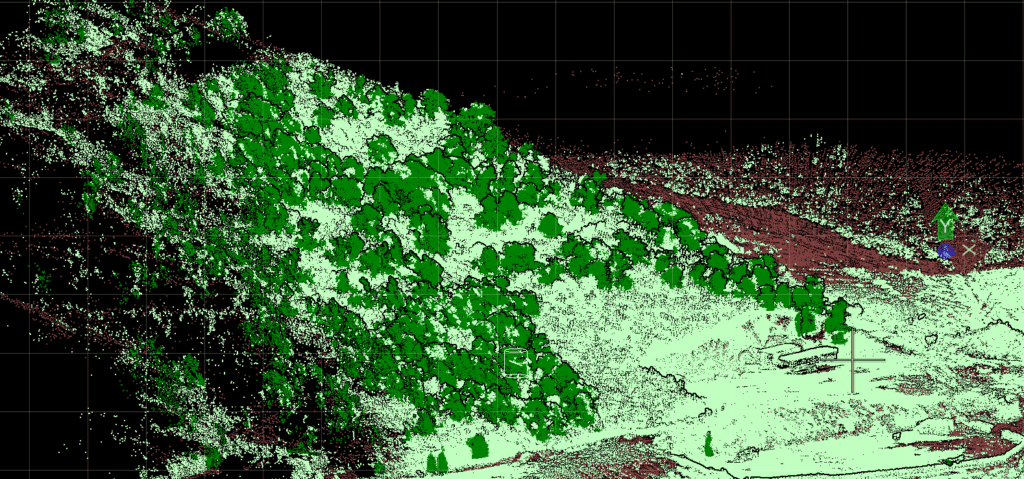
This model shows how to obtain a group of points that contain all trees, but in this project, we wanted to count the number of trees and obtain the properties of each tree, so we need to explore some additional methodologies.
There are several methods for individual tree segmentation, each with its own advantages and limitations. Here are some commonly used approaches:
Orthophotos and CNNs: Orthophotos, which are aerial images corrected for distortion, can be used along with Convolutional Neural Networks (CNNs) to segment individual trees. CNNs are deep learning algorithms that can learn to recognize patterns in images. By training a CNN on annotated orthophotos, it can automatically identify and segment trees in new images. This method is efficient and accurate but requires a large amount of labeled training data.
Point Clouds: Point clouds are 3D representations of the Earth’s surface created using LiDAR or photogrammetry techniques. Several methods can be employed to segment trees from point clouds:
CHM Maxima: Canopy Height Models (CHMs) are derived from point clouds by subtracting the ground elevation. The local maxima in the CHM represent potential tree locations. By applying clustering algorithms or region-growing techniques, these maxima can be grouped into individual tree segments.
Trunk Identification: In this method, the trunks of trees are identified based on their geometric properties such as shape, size, and density. Algorithms like RANSAC (Random Sample Consensus) or Hough Transform can be used to detect and segment tree trunks from the point cloud. Once the trunks are identified, the crown regions can be segmented using additional techniques.
Each method has its own strengths and weaknesses, and the choice of approach depends on factors such as data availability, accuracy requirements, and computational resources. It is common to combine multiple methods to improve the overall accuracy of tree segmentation.
In this case study, we used the CHM maxima model with the point cloud, because the bases of the trees were obscured by dense grasses and shrubs at the time of survey. The point cloud is separated into common classes, then individual trees were extracted.
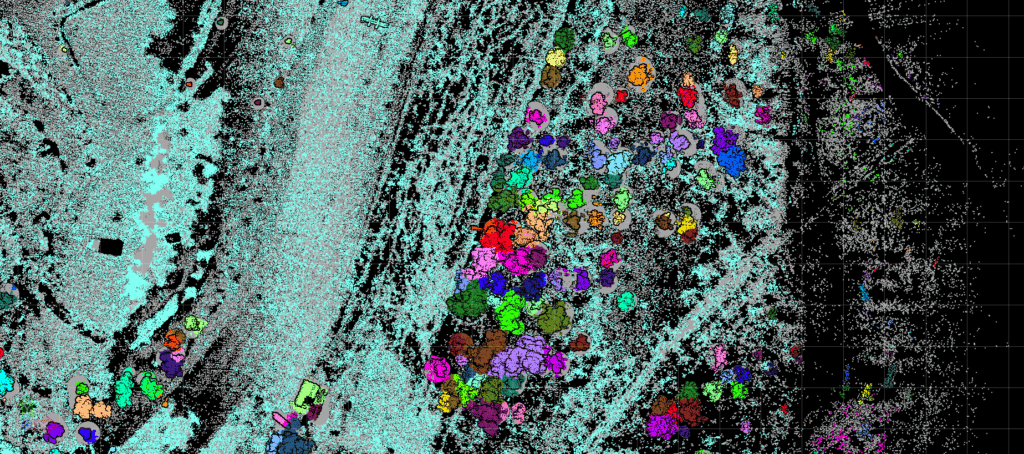
A critical part of tree detection is defining “What is a Tree?” For example, is a sapling 1.2m in height a tree? Or should we take a more traditional definition of 4m as a minimum height?
In this case study, we chose to try detection on as small of objects as possible, to push the limits of the classification algorithms. Any tall, high aspect ratio vegetation above 1.2m was considered a “tree” for this study.
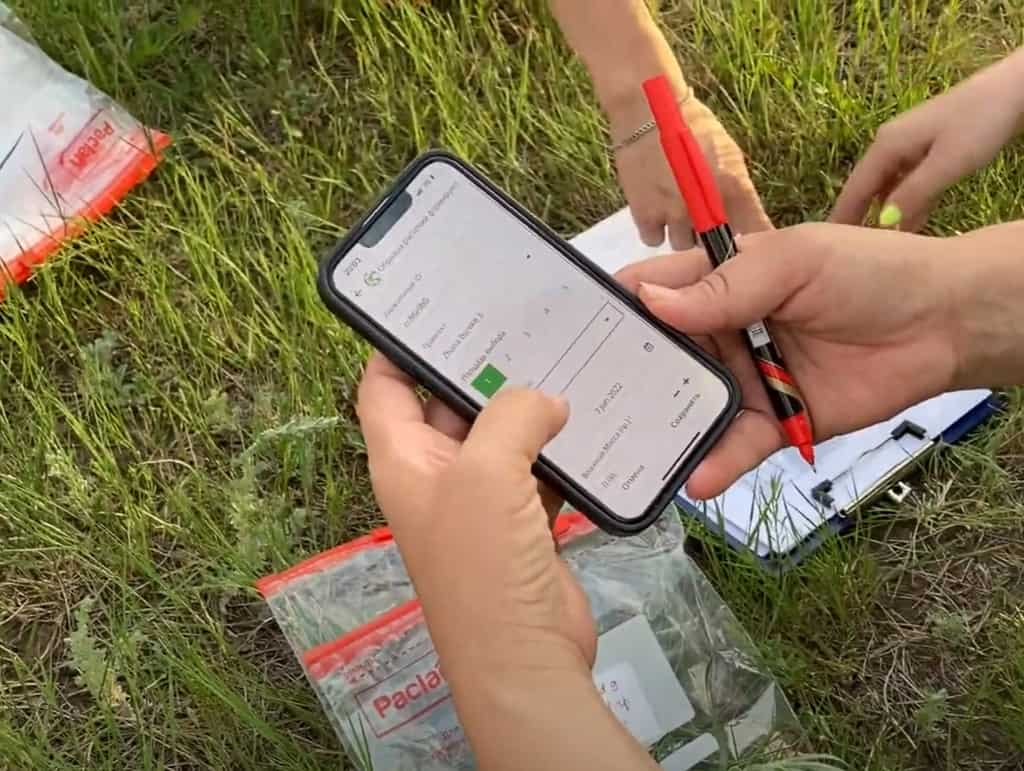
It’s important to note that no ground truthing was performed here. In future cases, to understand biomass, we need to know tree species, which requires a large number of ground samples within the LiDAR data, so we can train the classifiers to recognize particular species of trees.
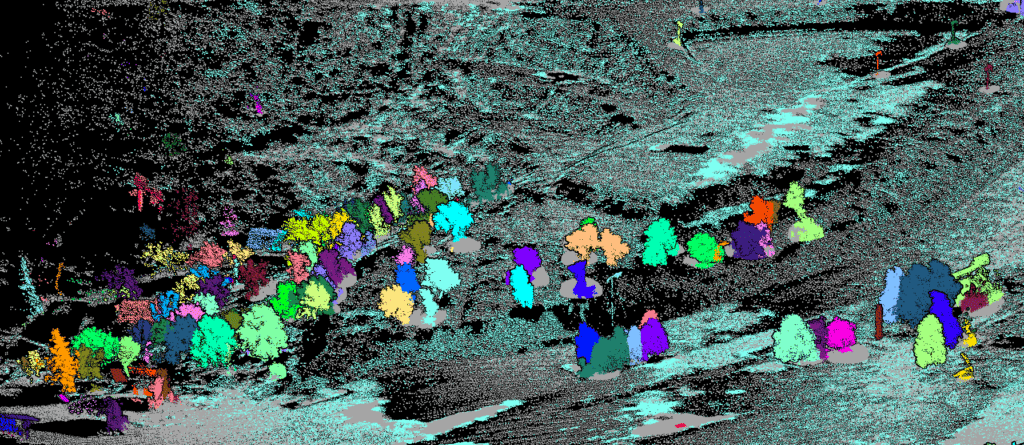
With our segmentation tools, we found over 6000 trees on the site. Each tree is given a unique ID and calculated attributes of XYZ coordinates, DBH (diameter at breast height), height, canopy width, canopy area, canopy volume, number of points, volume, and more.
We later removed known false positives, like these light poles in the image below.
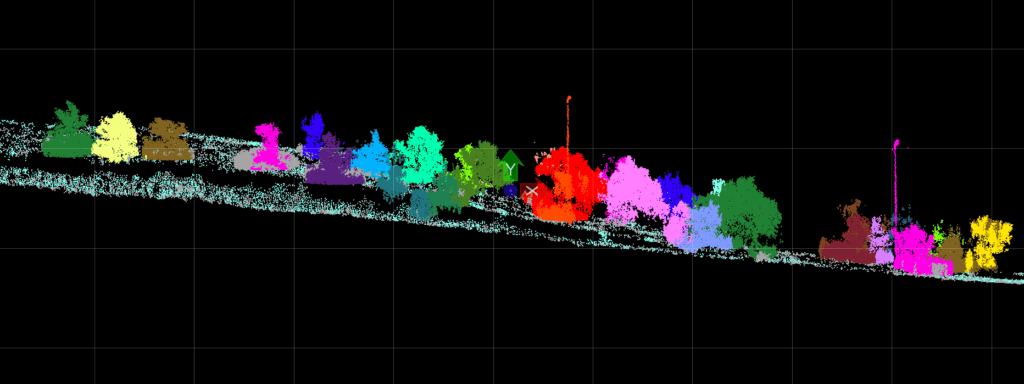
At this point, we had constructed a digital twin of the forest, but we still needed to extract forest attributes from that digital twin that are meaningful in real-world applications and predictive modeling systems.
Modeling Forest Attributes
LiDAR data can provide valuable information about various forest attributes. Some of the forest attributes that can be modeled using LiDAR data include:
Biomass: LiDAR data can be used to estimate above-ground biomass in forests. By measuring the height and density of vegetation, LiDAR can help calculate the amount of carbon stored in trees and other vegetation.
Canopy bulk density: LiDAR data can be used to estimate the density of the forest canopy. This information is important for understanding the structure and health of the forest, as well as for assessing fire risk and potential fuel loads.
Canopy fuel load: LiDAR data can help estimate the amount of fuel available in the forest canopy. This information is crucial for predicting fire behavior and assessing fire risk.
Canopy base height: LiDAR data can be used to determine the height at which the forest canopy starts. This attribute is important for understanding forest structure, as well as for modeling light penetration and understory vegetation growth.
Canopy cover: LiDAR data can provide information about the extent and density of the forest canopy cover. This attribute is useful for assessing habitat suitability, wildlife habitat connectivity, and overall forest health.
Tree height and diameter: LiDAR data can accurately measure tree height and diameter, allowing for precise estimation of individual tree attributes. This information is valuable for forest inventory, timber volume estimation, and species-specific modeling.
Forest structure: LiDAR data can help characterize the three-dimensional structure of the forest, including metrics such as vertical and horizontal canopy complexity, crown shape, and spatial arrangement of trees. These attributes are important for understanding habitat diversity, biodiversity, and ecosystem functioning.
Canopy gaps: LiDAR data can identify gaps or openings in the forest canopy. This information is useful for studying forest regeneration, successional dynamics, and identifying areas of potential disturbance or habitat fragmentation.
In this case study, we focused on canopy width and height, two basic attributes that are easily measurable. Because we did not have resources for ground truthing sample plots, we couldn’t measure some of the more advanced properties, like biomass using allometric measurements.
But there are other ways to measure biomass, which we explored:
Biomass Modeled From Height and Canopy Density
The US Forest Service uses a biomass model with LiDAR that doesn’t require allometric variables like DBH or species, so we opted to try implementing this model on our site.
Biomass determination using this regression model involves utilizing the number of returns (density) above mean height as a predictor variable. The regression model is used to establish a relationship between the density of returns and biomass.
To determine biomass, we calculate a surface for the mean height, calculate the number of initial returns, and the total number of returns above the mean height surface. These parameters help establish the correlation to canopy density, and add corrections for tree height.
We haven’t conducted ground samples, so our regression performance could be much different, but USFS has tested the model at an R^2 of around 85% in large-scale UAV-LiDAR acquisition plots.
As a first pass (without ground truthing sample plots) we’ll adopt a 20% error on the measurements depending on the biomass estimation model, given that we’re transplanting the regression from Arizona to Almaty. Given a larger research work, we’d ideally create our own sample plots and be able to choose our own regression parameters.
Overall, our digital twin estimates:
6311 trees (error unknown)
Average height of about 3.1 meters. (error approximately 5 cm)
Overall standing biomass of 351 ± 70 metric tons
Biomass per tree of 55 ± 11 kg/tree on average
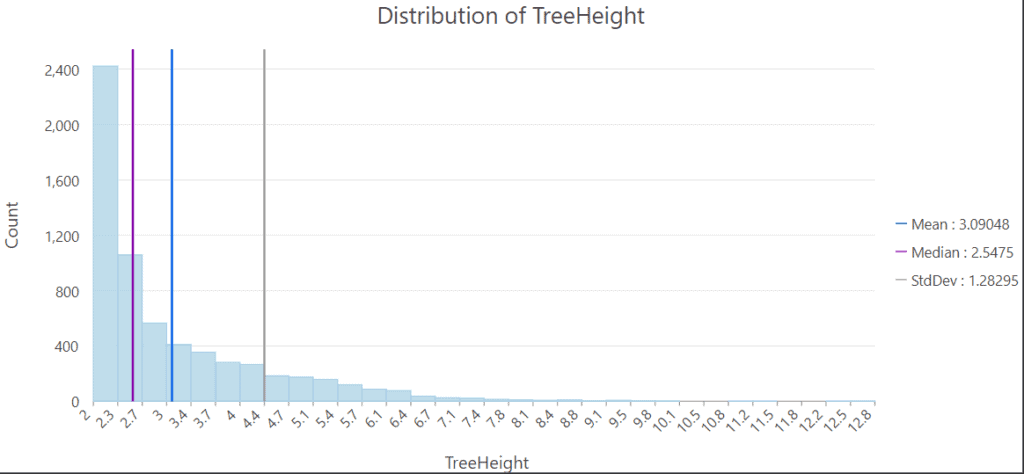
The amount of biomass per tree seems about on par with the small, thin deciduous trees we observed on the site.
Higher-accuracy models of biomass can be obtained from species-specific allometric interpolation. Since we know the DBH (diameter at breast height), height, and many other attributes, we should be able to apply these factors to a more direct model of biomass and tree age, if we know the tree species.
Allometric attributes from LiDAR:
• Tree Location Latitude, Longitude, Elevation
• Tree Height
• DBH (Diameter at breast height)
• Crown Diameter
• Crown Area
• Crown Volume
In carbon development programs, we know the species of each tree because they are recorded in a GIS at the time of planting, and estimation is much more straightforward.
Still, forest stock quantification with a reasonably high degree of accuracy is possible even without any ground-truthing work, providing data on forests or urban areas where previously there was none.
Summary Findings
Tree digital twins like the one we’ve created above can play a crucial role in monitoring forests by utilizing growth prediction models and high temporal resolution revisits.
By combining data from UAV-multispectral and satellite-based sensors, these digital twins can detect photosynthetic activity and changes in mechanical attributes such as height, width, and bulk density.
Growth prediction models are essential tools for understanding the development of trees over time. By incorporating various environmental factors like temperature, precipitation, and soil conditions, these models can estimate how trees will grow in the future.
Tree digital twins leverage these models to simulate the growth patterns of individual trees within a forest.
High temporal resolution revisits enable frequent monitoring of forests, capturing changes that occur over short periods.
This is particularly useful for detecting variations in photosynthetic activity, which indicates the health and vitality of trees.
By analyzing the spectral signatures captured by UAV-multispectral and satellite-based sensors, tree digital twins can identify fluctuations in chlorophyll content and other indicators of photosynthesis.
In addition to monitoring photosynthetic activity, tree digital twins also assess changes in mechanical attributes like height, width, and bulk density.
These measurements provide insights into the structural integrity and overall health of trees. By comparing current measurements with historical data, digital twins can identify any deviations or abnormalities, allowing for early detection of potential issues such as disease or stress.
By integrating all this information, tree digital twins offer a comprehensive view of forest ecosystems.
They provide real-time updates on the growth and health of individual trees, enabling forest managers and researchers to make informed decisions regarding conservation efforts, resource allocation, and sustainable forestry practices.
Ultimately, the use of tree digital twins enhances our ability to monitor and protect forests, contributing to their long-term preservation.
Cheaper, Faster… and Better?
Digital twins of trees, created using a combination of LiDAR, UAVs, and remote sensing, offer a superior solution compared to traditional forest mensuration techniques.
This rare blend of three features – being cheaper, faster, and higher quality – makes it an ideal choice for accurately assessing and monitoring forests.
The use of LiDAR technology allows for precise and detailed measurements of tree attributes such as height, diameter, and volume, on every tree, not only on a small sample. Ground surveyors are still required, but focus on calibration of data, rather than tedious collection.
This eliminates the need for manual measurements, reducing costs associated with labor and equipment required for traditional forest mensuration techniques.
Old LiDAR was bulky and had to be mounted on helicopters or airplanes, increasing cost dramatically and also decreasing frequency of use.
LiDAR on unmanned aerial vehicles (UAVs) however, enables rapid data collection over large areas, and rapid revisit time. UAV-LiDAR can quickly capture high-resolution data and collect data on tree structure and health.
In addition, multispectral and photogrammetry sensors can co-fly LiDAR missions, to capture a holistic dataset, providing not only tree structure, but also tree height and ultra-high resolution orthophotos ready for ML object detection.
This significantly reduces the time required for data acquisition compared to traditional methods, which often involve ground-based surveys that are time-consuming and labor-intensive.
Lastly, remote sensing techniques, such as satellite imagery and aerial photography, complement the digital twin approach by providing additional information on forest dynamics and environmental factors.
By using a combination of approaches, we can emphasize each approach’s strengths. These techniques allow for continuous monitoring of forests over time, enabling better understanding of changes in tree growth, health, and overall forest condition.
In summary, rTek’s case study found that the combination of digital twins, LiDAR, UAVs, and remote sensing offers a cost-effective, efficient, and high-quality solution for forest assessment and monitoring in a variety of scenarios.
By streamlining manual measurements and data collection processes, as well as offering detailed insights into forest dynamics, UAV-LiDAR represents a significant breakthrough in conventional forest mensuration methods.
We at rTek are looking forward to a brighter, more sustainable future where we can enable individuals responsible for forests to make more informed and environmentally conscious decisions.

