So… you’re probably using the wrong word for your topographic data (awkward).
If it’s your first time buying a topographic map, you’re probably worrying about getting the scale right.
Do I need 25,000:1? Oh, it’s soo much more detailed, but soooo much more expensive… Or, you might be worrying about where to get a paper copy.
Don’t worry, there’s an app for that.
With the digitization of topographic maps, a lot has changed since the days of paper.
Aside from traditional terrain maps like the one below, you can also buy a dizzying number of other map types, all with subtle differences. And on top of that, more resolutions and accuracies are available than ever before.
Between map type, scale/resolution, and accuracy, there are hundreds of choices. That’s because maps can solve more problems than ever before. But not to fear, there’s no need for memorization. A couple of core principles are all you need to find the right map.
By the end of this blog, you’ll be able to make confident decisions about which maps you need, and the secret word that you can use to sound like a GIS pro in any situation.
Topographic maps aren’t what they used to be.
Topo is Latin for place, and graphy is Greek for write. The term topography was invented in ancient Greece, and was more concerned about roads and passageways, but today, we think of a topographic map as a way to show elevation and contours of the land.
So back in ancient Greece, topography was “writing places,” or basically just making maps. It’s a bit different today.
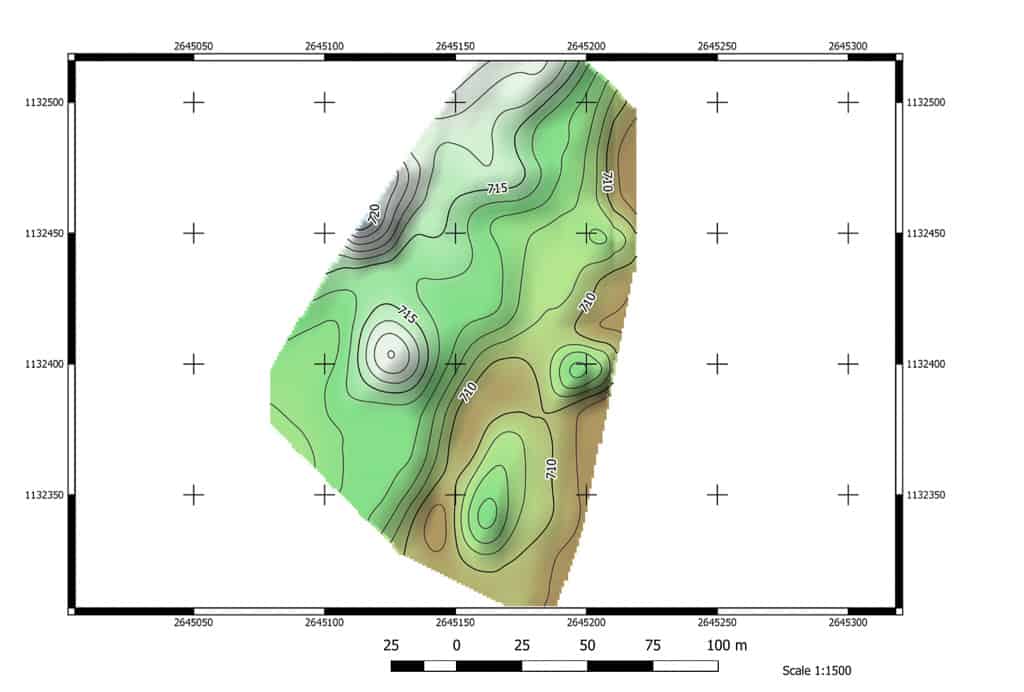
A topographic map is a type of map that shows the shape and elevation of the Earth’s surface. It is commonly used in GIS and remote sensing for various applications, such as hydrological and geological modeling, urban planning, and disaster management.
But “Topology” has another meaning.
In a general sense, topology refers to the study of geometry and spatial relations that remain unchanged under certain transformations, such as stretching or bending. In GIS and remote sensing, topology is often used to describe the spatial relationships between features, such as adjacency, connectivity, and containment.
I think of topographic maps as a presentation medium, where many different types of data can be shown. You can show traditional contour lines and hillshades, or you could show trees, buildings, roads, and water features.
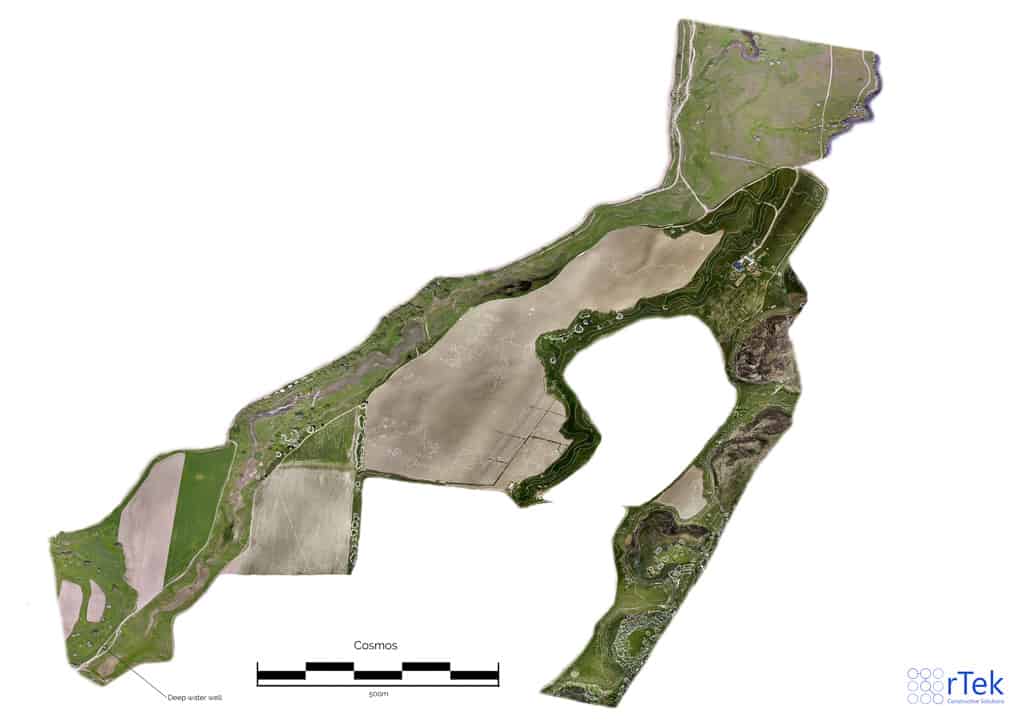
For example, centimeter-scale topographic maps are possible using drones and are necessary for things like mapping power lines. With digital topographic maps, you can show very fine detail, overlaid on top of beautiful imagery.
Even digital maps can be too dense
On paper maps, careful consideration needs to be paid to reduce clutter and make the map readable. With digital maps, there are other issues that happen when the detail is too fine.
1. First, contour lines don’t work. You want the contours to highlight hills and valleys, not individual rocks.
2. Datasets get huge. Every double resolution is quadruple the data size. That’s quadruple the loading time. For example, the map above, covering about 25 ha, is over 1.5 GB.
3. There’s no all-in-one topographical map anymore.
With digital maps, we can separate parts of the map into layers. That allows us to keep high-detail, and reduce the clutter so we can clearly see what we’re looking for. This is good because it enables more detail, but map makers and buyers need to know which layers they specifically need for each project.
Instead of large-scale topography, ultra-high resolution maps show roughness details like potholes in roads and evidence of flooding erosion or settling of the land that would be otherwise impossible to see.
Other maps can be of the surface – not of the earth, but of building tops, urban areas, or even underwater basins. These are all models of places, and when we talk about them in a digital sense, they fall into a couple of common categories.
DEM vs. DTM vs. DSM: What’s the difference?
Digital Elevation Model (DEM), Digital Terrain Model (DTM), and Digital Surface Model (DSM) are the three most commonly used terms when describing the digital models of the world around us.
TL;DR
A DEM is any digital model with elevation included. A DSM is a type of DEM, but of a surface— like if you draped a piece of fabric over the earth. And a DTM is a DSM, but only of the terrain. For a DTM in cities, you have to subtract buildings, power poles, etc. For a DTM in the mountains, you need to subtract trees, snow, and vegetation.
Although these terms are often used interchangeably, they are actually quite distinct and different.
Read on to hear about what they are, some of my favorite examples, common misconceptions, and why sometimes they actually can be used interchangeably. Also: learn about other DEM types— like CHMs, SMMs, and nDSMs.
So what is a Digital Elevation Model (DEM)?
A digital elevation model is a digital model that includes elevation as one of the attributes. Both digital terrain models and digital surface models are types of digital elevation models.
There aren’t any specific rules for what can be a digital elevation model, except that the data in the model must at least represent the elevation.
What is Elevation?
Elevation typically refers to the height above mean sea level (MSL). But it can also mean height above a specific place that you’ve designated as “zero.”
DEMs are the basic building blocks that allow us to make topographic maps, so that hikers can safely navigate mountainous terrain, and new roads can be constructed along ideal routes.
But they’re also used to plan irrigation systems, simulate floods, and detect deforestation. Aside from good imagery, a high-resolution DEM is the most important type of data you can add to a map.
As a cartographer, basically everything I make has some kind of DEM.
When I’m processing a dataset, I create many different types of DEMs before the final versions are made.
When using UAVs, we’re dealing with a point cloud most of the time- so it’s 3D. The top-of-the-point cloud is actually junk – there’s noise above the real data. And the bottom of the point cloud is junk too.
We have to filter out points and find the probabilistic surfaces- the tops of buildings, top of vegetation, and top of the ground, and probably do interpolation between before we get something useful.
And that product is always a DSM- because we were targeting a specific surface when we task our filters and ML classification models to segment the data.

Stuart Bowlin
UAV and GIS Specialist
When were you last at the dentist?
If you’re like me, you remember peeking at the screen to see inside your skull. The resolution of X-ray machines today is… perhaps too much.
That X-Ray picture is basically a DEM of your head. It’s a flat picture where the color (or black and white) shows depth and density.
If your dentist has newer equipment, they may have even shown you your teeth in 3D. That’s just like a DEM too. The software connected to the X-ray camera can convert the images into a 3D model, then you can tilt and fly through it just like a video game.
Just like X-Rays, DEMs can be shown in 2D or 3D. If you need a conventional map, you can print them out from a particular perspective and make a 2D elevation model. But if you want the best possible way to view and understand the data, you’ll view the DEM in 3D. You can even fly through it just like a video game.
Ever played an open-world video game?
These games use DEMs to create the ground that you can walk on.
And big-budget shows like The Mandalorian use DEMs to create virtual sets. In both cases, the DEMs used are often places in the real world, digitized, and modified to create virtual environments. This process of making the real world into a digital twin is called reality capture.
Pictures vs. 3D models
A Raster DEM is a unique kind of picture. If you view it in a photo editor, it probably won’t make a lot of sense. But in 3D space, software can recognize the DEM as a 3D model. A DEM with pixels is called a raster (raster is German for “screen”).
And there’s another kind of DEM – a native 3D model. These kinds of DEMs are typically surfaces and can be made from the real world, or artificially generated from 3D design software.
As cartographers, we make Vector DEMs because they are much smaller file sizes and more efficient to work with, and can be read more easily by algorithms like machine learning models or flow simulations.
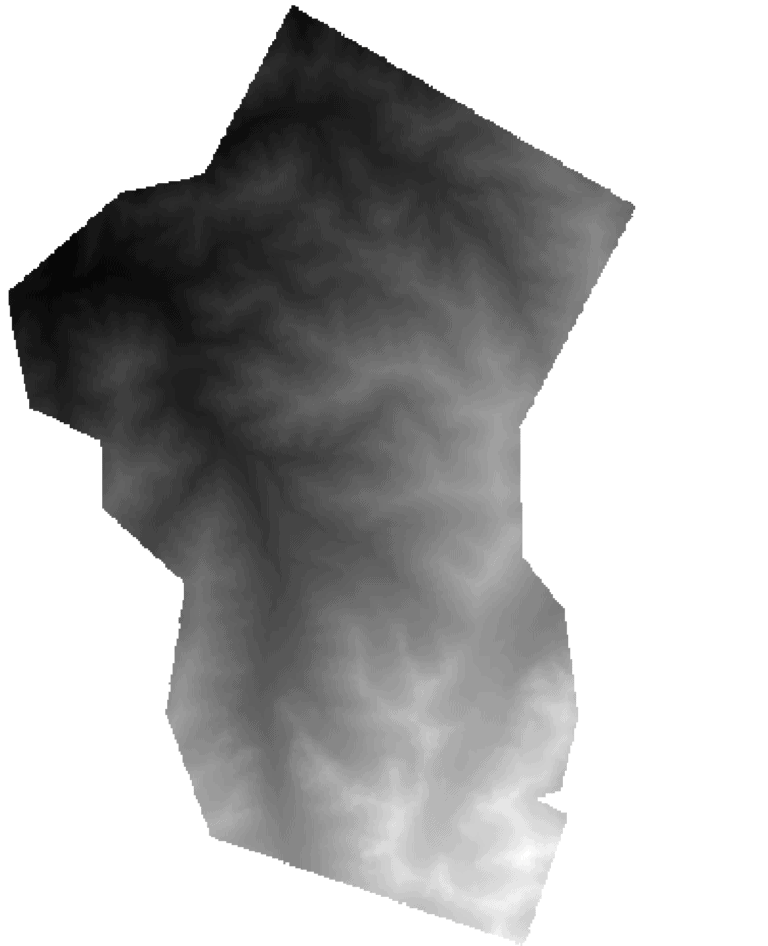
But for raw data, image-based or Raster DEMs are the most common types. Though you wouldn’t recognize them as the same thing as images you take on a camera.
Feeling bold? Try downloading a raw DTM here, from the USGS Explorer.
In an image from your phone camera, each pixel has a value of RGB, or Red, Green, and Blue. For example, (x,y,255,255,255) is the RGB code for white. But DEMs don’t use RGB.
Notice the x & y coordinates?
Each image, whether it’s from your phone, or made with GIS software, has x and y coordinates. On your phone, the (x,y) is the address of the pixel. X is the number of pixels from the left edge of the image, and Y is the number of pixels from the top edge.
With DEMs, on each pixel, the x,y attributes represent the location. Although they still show as pixel addresses in the file, every DEM file also has special attributes that tell the software the real-world coordinates of the four corners of the image.
DEM images are usually TIFFs, because the TIFF format allows pixels to have a numeric value. GeoTIFFs are TIFFs with metadata attached that indicates the extent (coordinates of the corners) and projection system (related to how the map is stretched across the land).
DEMs don’t have RGB. When you view them on a screen, they look black and white by default.
That’s because instead of three color values (red = 255,0,0), each pixel has a single elevation value, for example: (156.2945).
Just by selecting the pixel and viewing its data we can tell that this location has an elevation of 156.2945 meters.
How to view DEMs
When we want to view a DEM on a screen, we need to choose how we want to view it to best highlight the information within the dataset.
Some people prefer to view a DEM in black and white, where black represents the lowest value on the screen or in the raster image, and white represents the highest value. But this can sometimes make fine detail harder to see, if the range between the low point and high point is very large.
To see more detail, we use specific, intuitive colors, like red, yellow, and blue, to represent height. We might set blue to 100m, yellow to 150m, and red to 155m. That’ll help us emphasize the detail near our area of interest.
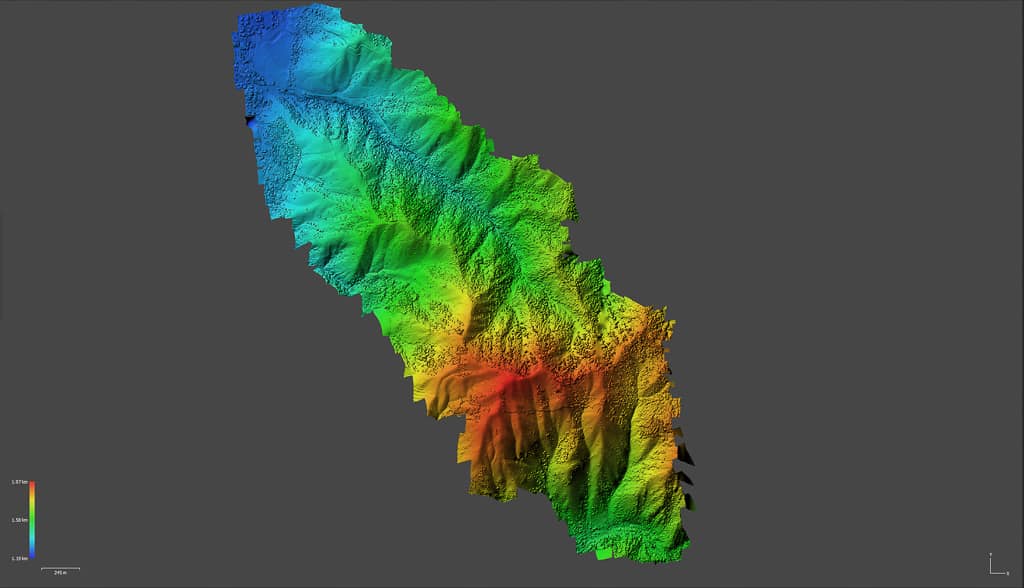
When we start adding things like contour lines to further emphasize detail, or points to show the tops of hills or mountains, it begins to look a lot like a topographic map.
We also apply hill shading algorithms to show natural relief as if the sun were hitting the surface. This helps us see the shapes and understand the 3D surfaces of the DEM.
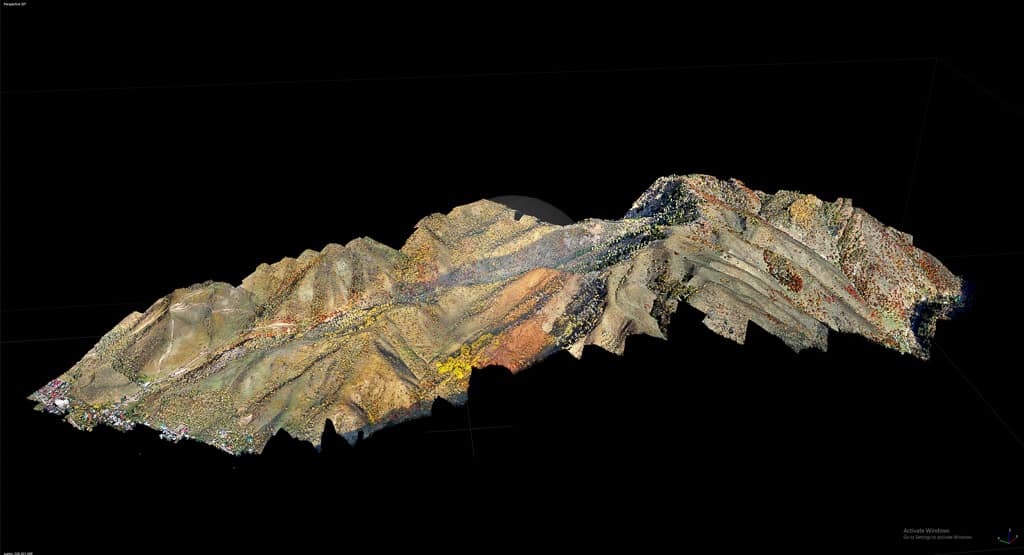
If it’s too difficult to understand a DEM from the top down, we can make another view. This one above is called an oblique view. It’s like a virtual camera that we can place anywhere around the 3D model to show better perspective.
DEMs aren’t always used for land.
A common misconception about DEMs is that they always represent the earth’s surface. That’s their most popular use, but DEMs can also be used to represent other types of information:
DEM uses that aren’t terrain:
- Cut/fill maps in construction or agriculture
- Subsidence and erosion models
- Urbanization or deforestation models
- Vegetation models
- Snow accumulation models
- Water table, aquifer, and sub-soil models
- Building and indoor 3D models and scans
What is not a DEM?
If a pixel in a DEM represents the height, what happens when we want to visualize a model as 3D, but we want to set the height to show the density of snowfall, or the number of people per square km?
Well, those aren’t DEMs anymore.
However, you can still “enrich” a DEM with other data if you want.
For example, in flood zones, you can have a DEM that shows the floodwater height.
You can add more attributes to each pixel, like the water’s speed and direction (vx, vy). The pixel might then look like this (x, y, h, vx, vy).
They’re just numbers, and you can add as many as you want, then visualize as needed or incorporate it into your custom algorithm.
What is the difference between a point cloud and a DEM?
A point cloud isn’t a DEM. The main difference is that a point cloud has depth.
If the real world is made up of atoms, clumped into molecules, clumped into objects, then a point cloud is a much closer representation of those things. Except the individual points are much bigger, usually one centimeter or larger.
The basic point cloud is just like a DEM, which uses little squares called pixels with a height attribute, except point clouds use little cubes. These cubes are called voxels.
Remember how we were saying you can have as many numbers as you want attached to each pixel? Point clouds were made for this.
The most common point clouds are created from LiDAR (Light Detection and Ranging) data. LiDAR uses lasers to penetrate between objects like trees, producing a cloud of points where the laser has bounced back to the sensor.
Each point’s location is known because of the ToF (time of flight), or the amount of time it took for the light to travel out and back).
LiDAR sensors also capture other information for each point, like the intensity of reflection, return number, scan angle, and even RGB color
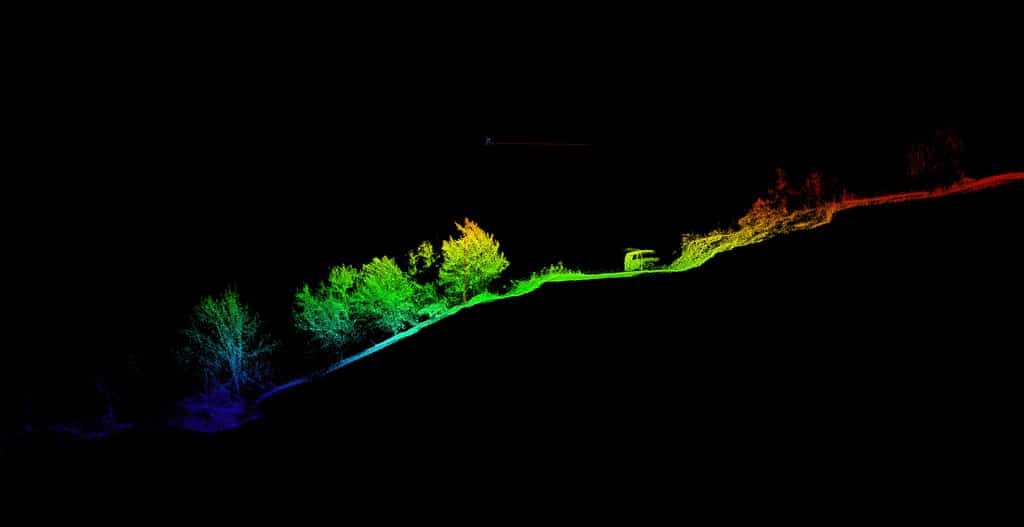
You can then use an algorithm (AI or conventional) to separate these layers from the model, isolate them, and convert to a 2D + height DEM, as if you took a picture looking straight-down on the point cloud.
Here are some common DEMs you can extract from a point cloud:
- DSM of filtered objects: There are many machine learning models that can detect the object type (ground, noise, tree, car, pavement, building, etc.) from LiDAR or photogrammetry-derived point clouds. Then you can create a DSM of the isolated object class. For example, a DSM of just trees.
- DTM: Isolating the ground in the point cloud can create a ground-DSM, otherwise known as the DTM.
- CHM (Canopy Height Model): The CHM is a normalized model of the height of each tree, as if placed on a flat surface. It’s taken by subtracting the DTM from the tree DSM.
- Building Height Model: Just like the CHM, a building height model is the building layer with the difference in ground height (DTM) subtracted. This makes each building as if on a flat ground, so that heights can be compared directly.
- Surface Movement Model (SMM): Utilizing a technology like d-InSAR, two DSMs are subtracted from each other to detect movement of the surface. Millimeter-scale changes like sinking buildings are detectable.
What is a Digital Surface Model (DSM)?
A DSM is an elevation model, but it represents a surface. Think of the earlier example of laying a fabric over the earth’s surface. You could lay a fabric on pretty much any set of objects, so this is what a DSM is- the resultant face of this fabric.
So the main question about a DSM is “What objects to include or exclude?”
In flood mapping, you might need multiple DSMs: one with include hardened surfaces like concrete, roads, and buildings, another with trees, and another with erodible surfaces like bare soil or sand.
If you are mapping a large-scale irrigation system, your DSM might include the basin of a reservoir (obtained using SONAR), canal networks, and irrigation ditches.
The biggest misconception about DSM is that it represents the bare earth’s elevation, which is not true. A DSM could include all features on the earth’s surface, real or designed, and the term DSM doesn’t imply any specific set of objects.
The Building DSM
Not just for buildings.
The most common type of DSM is the Building DSM. It includes trees, vegetation, buildings, powerlines – everything. The Building DSM is ideal for 3D modeling and urban planning, as it represents all features on the earth’s surface, including man-made structures.
This is useful when designing buildings and other structures that need to be constructed in a specific location.
Usually, the Building DSM is a baseline used to subtract other DSMs. It helps cartographers to build isolated models that highlight specific features like trees, buildings, or parking lots.
The Future DSM
Another type of DSM is very common: the Future DSM. The surface DSM is derived from the Building DSM, but includes modifications for planned construction.
For example, the Future DSM may help to plan the impact on sight lines for real estate development or cell towers, or to run flood risk scenarios against plans for widening streets or adding parking lots.
Vector DSMs
Once a particular class of data is chosen, the model can be made into a vector object. This can be quite useful when you need to summarize the statistics of an area, or to visualize the differences between objects.
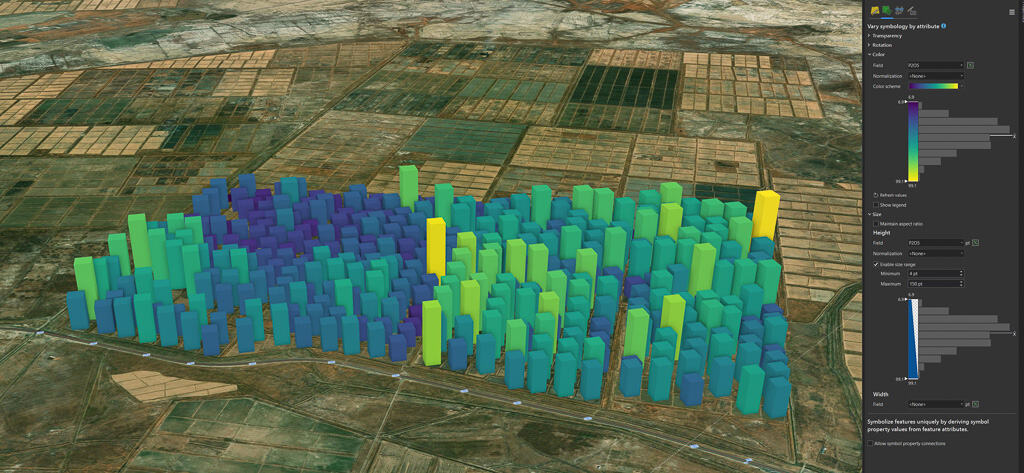
A vector DSM is a collection of 3D objects.
In this case, the important details on the surface (the average soil height of each rice patty) is represented for each object. We then show the object’s height and color as an exaggerated view.
Rice patties are irrigated through a central canal network, and flooded above the surface of the soil. Ideally, the flood water should only be a few centimeters deep across all patties. The deeper the water, the more water consumed, due to higher infiltration and flow rates.
Although the height differences between plots are only a few centimeters, small differences between adjacent plots can greatly impact the irrigation efficiency of the whole system.
The bright yellow and dark blue columns help to visually identify rice patties that need to be dug out or filled in to match their neighbors.
Finally, a vector DSM like this can be easily exported to a spreadsheet and task list for excavation companies to complete.
What is a Digital Terrain Model (DTM)?
A digital terrain model (DTM) represents the bare earth’s elevation.
DTMs are created by filtering out non-ground features from a DSM. A filtered DSM will have holes in it where buildings used to be, so the DTM needs to be filled in using an interpolation algorithm.
The biggest misconception about DTMs is that it represents only the natural ground. DTMs are created from the same sources as DEMs, so they can also be affected by various factors that can cause inaccuracies, like interference from buildings and above-ground objects.
For hydrology, DTMs include man-made changes to the ground, like earthwork, underground parking garages, stormwater diversion culverts, concrete, and asphalt surfaces. In cities, most of the elements in a DTM are man-made. They still represent the bare earth, but including the modifications of urbanization.
Shallow vegetation and permanent ice or snow can be particularly challenging for DTM creation. Because of the inability to access the surface, special tools are often needed to map these areas.
For example, SONAR and bathymetric LiDAR might be needed together to map reservoirs, lakes, or waterways. Ground-penetrating radar is required to detect the soil’s surface beneath the snow. And GNSS or INS-based survey poles might be necessary to map between buildings, in tunnels, underground, or beneath heavy vegetation.
Despite its difficulty in creation, a DTM is ideal for a variety of projects, enabling urban planning and infrastructure design.
Because a DTM represents the bare earth surface, it forms an accurate base for hydrologic models like flood and precipitation simulations, fire simulations, erosion algorithms, weather prediction, and more.
What are normalized DSMs?
Normalized and differential DSMs are DSMs that were created by subtracting two DSMs from each other. This subtraction process allows cartographers to create much more interesting and informative map layers.
An nDSM, or Normalized Digital Surface Model, is a digital surface model that has the DTM subtracted. This sets all objects above the terrain on a theoretical level surface, so they can be more easily compared.
nDSM real-world example:
Take, for instance, an app that uses drones to measure the trees in a park each month to see how they’re growing. The problem is that we need to measure the height of each tree, with a point for each tree, that we can repeat each month.
First, we need to create a Building DSM and DTM to use for reference, but we’re going to need an nDSM.
The clue is in the word height.
To measure a tree’s growth over time, you need to know its height above the ground. This isn’t the elevation of the tree, but the elevation of the tree minus the elevation of the ground.
Managing a park’s trees requires knowing which trees aren’t growing properly, like trees with pests, disease, or watering problems. In order to know what’s normal and what’s abnormal, we need to know the height of trees relative to each other. And the park is on a hill, so the elevation of trees is wildly different north to south.
This is where the nDSM comes in.
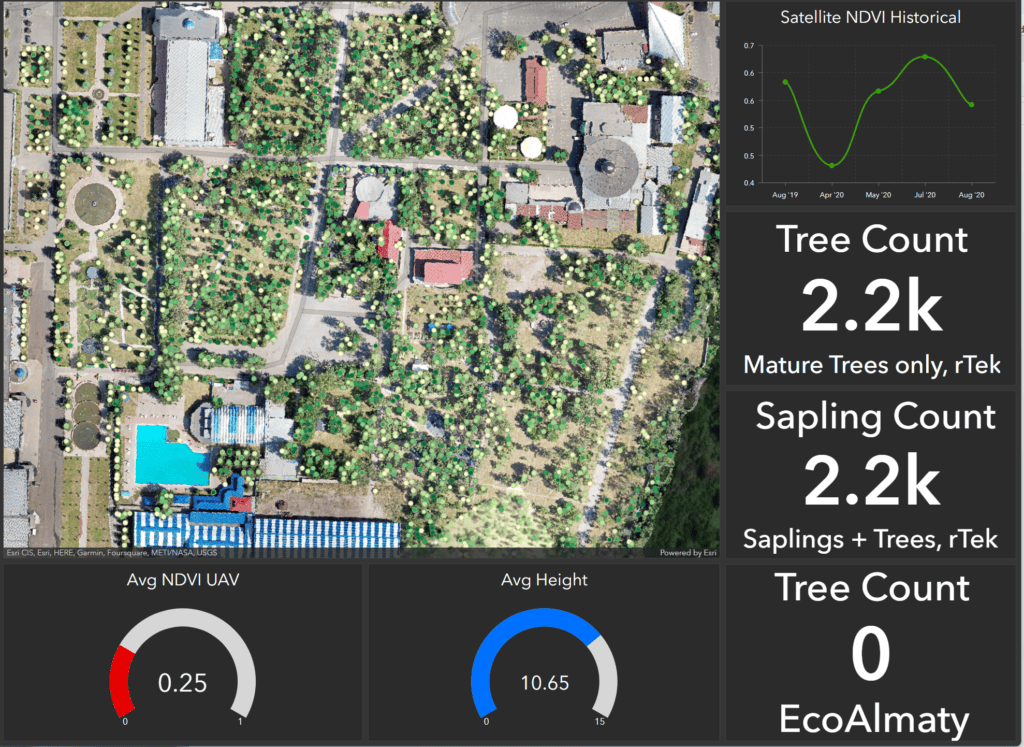
Trees all blend together in a DSM. That’s because in our DSM, we have trees and all other objects that appear in this park.
We need to do several steps to isolate the trees:
- Filter the point cloud that generates the Building DSM for trees only. Trees can be filtered out because they are green(ish) and are taller than low-level vegetation like grass and shrubs. A machine learning model automatically classifies all of the different points.
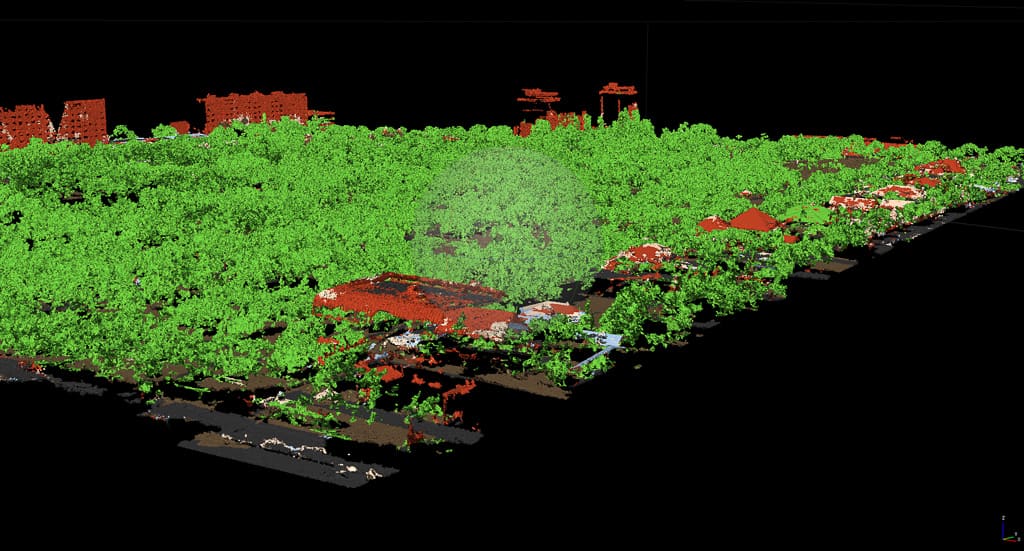
- Make a DSM from the filtered point cloud. This is the tree-only DSM. The DSM should not be interpolated between trees (everything that is not a tree is a black abyss)
- Perform this subtraction: DSM – DTM = CHM. The CHM (Canopy Height Model) is obtained by subtracting the DTM from the DSM for trees. This CHM is a DSM of the tree heights above the ground.
- Apply a local maxima algorithm to identify the treetop points, where the tops of trees happen. The tree heights can then be sent to a database and used to drive animated dashboards like the one above.
Wrap up
DEM, DTM, and DSM are often used interchangeably, but they have different distinct meanings and applications. Understanding the differences between these terms is essential for accurate analysis and decision-making in GIS and remote sensing.
When in doubt, think of laying the fabric over the world. The Building DSM is the resulting surface model from the fabric laying on top of everything.
Then, when you remove the stuff sticking up above the terrain, and re-drape your fabric over the resulting surface, you have the DTM. In a city, DTMs should include pavement and concrete, but not buildings.
If you’re using the DTM for hydrology, you have to include everywhere that water can flow— that includes parking garages and underground openings.
DTMs and DSMs are all DEMs. When in doubt, go with DEM— that’s any digital model (built or designed) that models elevation (besides point clouds).
By understanding the differences and misconceptions between DEM, DTM, and DSM, cartographers can use the appropriate model for their specific analysis and applications, and go beyond them to solve specific problems.
Overall, it is crucial to note that while these terms are sometimes used interchangeably, and often come from the same raw data, they represent different sets of rules, and they should be used appropriately depending on the specific application.
The future of mapping depends on accurate data collection, processing, and analysis.
But even more, it depends on communication.
Certainly almost no one loves using acronyms in their day-to-day life. But there are a few that represent fundamental, true rules that help frame the world around them.
For cartographers, DEM, DSM, and DTM might just be part of that rare group.

