Geographic Information Systems (GIS) can save time and money if applied properly.
You may not know it, but you use many GIS systems every day already. Let’s take a look at the 5 top ways you can use GIS, in 2023.
1. Food Delivery Apps
Food delivery apps use GIS extensively to make sure your food gets to you quickly and still piping hot.
When you look at the app, a GIS calculates the delivery times to you and compares your location and time to all of the restaurants in the database.
You’re served with the most popular and closest restaurants only, saving you time.
When you place your order, the system sends the order to the restaurant, and a GIS Spatio-temporal algorithm calculates the best time to request a courier.
The best food delivery apps like Wolt don’t call the courier right away. They use machine learning GIS algorithms to predict exactly when the meal will be ready to pick up.
Couriers usually wait for just seconds before picking the meal up and taking it to you.
A dizzying array of data inputs are required for these artificial intelligence algorithms.
Among other inputs, the algorithms learn from the restaurant’s typical serving times, the current number of orders, city traffic conditions, ongoing sports events or performances, and amount of couriers available.
Food delivery apps even track the number of times users open the apps, partial orders, and locations of users. These parameters all add up to the fastest delivery possible.
Couriers use navigation systems that are custom-designed for them. GIS tracks their positions at all times and serves them the closest, highest value routes only.
These systems are nice because they optimize for the eater’s time, and also for the couriers’ maximization of profit.
Because all interests are aligned in the algorithm, the usage of GIS-AI is a win-win for users and workers alike.
2. Remote Worker Check-Ins
COVID-19 has complicated working, with so many workers telecommuting. When workers get sick, it’s not only bad for workers, but it lowers business productivity.
GIS Systems like ArcGIS Online’s Survey 123 tools and the Coronavirus Business Continuity Solution assist businesses with reopening and operations while working remotely.
With the unique solution, workers can check in with their daily locations, and site managers can easily see how many workers are on-site at any time.
Safety can be maximized, because workers can reserve indoor workspaces and maintain social distancing, just by using the mobile app.
If workers feel symptoms, they can make a real-time check-in, allowing contact tracing to be performed automatically.
The Coronavirus Business Reopening Solution allows businesses to track their reopening status. It’s useful especially for businesses with several work sites spread across a large area.
Business managers can view site information on centralized dashboards using ArcGIS Online. Dashboards even work well on mobile devices, for 24/7 mobile management.
By systematically tracking safety objectives and milestones, businesses can comply with local regulations, minimize closure time, and prevent costly re-closure enforcement actions.
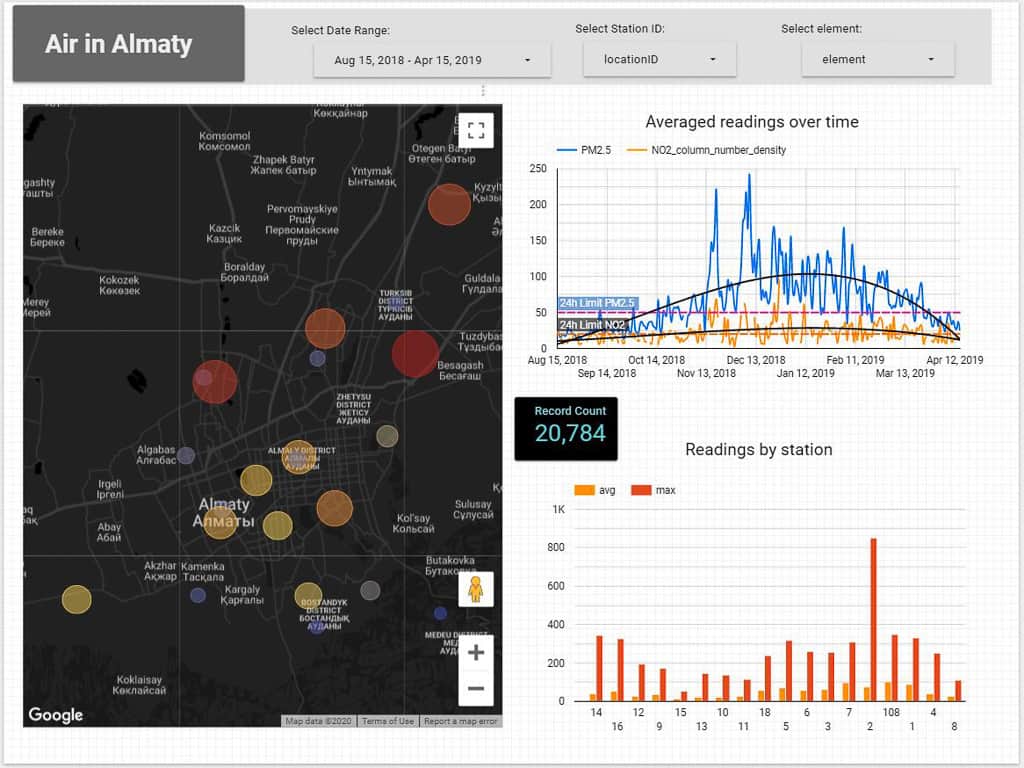
3. Checking Air Quality
One of the major benefits to GIS systems is their ability to give you specific information that applies to where you are. Location services software on your phone can figure out your location using GPS, local WiFi networks, and IP address.
By using mobile-GIS, simple mapping data can become much more useful, for example, to check the weather outside. One of the most important things for your health is air quality.
The WHO recommends that adults breathe air that is cleaner than 25 micrograms of PM2.5 per cubic meter, over an average of 24 hours.
Aren’t There Safe Pollution Levels?
There is no safe level of these PM2.5 particles. They’re particles smaller than 2.5 millionths of a meter wide, which is so small that the membranes in your lungs can’t filter them out, so they go directly into your bloodstream when you breathe them in.
PM2.5 particulate matter is responsible for over 5 million deaths per year worldwide. It’s the number one cause of premature death in the European Union.
In Adults, PM2.5 concentrations above 15 micrograms per cubic meter cause a variety of issues.
It has been estimated that 70–80 % of premature deaths attributable to outdoor air pollution are due to ischemic heart disease and strokes, 15–25 % to chronic obstructive pulmonary disease and acute lower respiratory infections, and about 5–6 % to lung cancer [8–10].
Children are even more susceptible to disorders, as the “acceptable” levels defined by WHO are defined for adults, suggesting that child developmental issues, including lung cancer and acute lower respiratory infections, are strongly tied with air pollution.
How to See Levels Near Me?
There are many sources of information for PM2.5, such as IQAir, which has developed an app for iPhone and Android.
The app functions as a GIS, bringing together data from many sources and showing you the most relevant data (where you are).
There’s even an apple watch complication, so you can check the air quality with a glance before you go outside.
GIS systems don’t just store raw data. They can use your position to give you analytics, like comparisons between your air quality and other cities.
The systems can even forecast air quality, just like the weather, using sophisticated spatiotemporal algorithms. These algorithms learn from big data which includes a time and a geographic component.
The more data samples you can feed the algorithm, the more accurate it can be.
What Else Is Out There?
Many other pollutants are not well known, as PM2.5 levels are quite uncontrolled still in many parts of the world.
Although PM2.5 is certainly the highest priority, other harmful gasses can also be monitored.
Local ground stations can monitor these elements, but so can satellites.
- Nitrogen Dioxide Pollution
- Sulfur Dioxide Pollution
- Surface Ozone Pollution
- Carbon Monoxide Pollution
- Formaldehyde Pollution
- Methane Pollution
Satellite imagery, such as that from the European Space Agency’s (ESA) Sentinel-5P, is able to monitor all of the above elements from space, for everywhere on earth.
GIS apps like IQAir are starting to use this data- combining ground stations with satellite-based virtual stations. Now, no matter where you are in the world, you can
4. Keeping an Eye on Climate
We’ve all heard of climate change. You might not be aware of some things that affect our daily life, which are considered effects of a changing climate.
What Is Climate Change?
Climate change is a term scientists use to say that the normal weather in a particular place isn’t normal anymore.
Because of increasing greenhouse gasses in the atmosphere, the air is capturing more heat from the sun.
This heat causes the air currents to change, the jet stream to shift, the ocean to heat up more, and for ice to melt.
It also changes the structure of the atmosphere, causing air to flow in different directions, speeds, or for more storms to form.
Because of the increased energy in the global weather system, patterns are shifting and re-equalizing.
This means that historically rainy geographies can become drought-stricken and that boundaries of deserts can change.
GIS can help humans to adapt to these changing conditions, as nature becomes less easy to predict.
In GIS, we call this continuous process Disaster Risk Management (DRM).
What is Disaster Risk Management?
When disasters are harder to predict, it becomes more likely that they’ll impact us more. We don’t evacuate or prepare, because we don’t know what to expect.
Then, because the frequency of events is increasing, another disaster might occur. These so-called “clashes” can multiply the human and economic tolls on society.
Disaster Risk Management, then, is the assessment of the risks and the adaptation to changing conditions. Studies of “what-if” scenarios are completed. Then, scientists and planners can understand better what to do to avoid or mitigate these disasters.
Some disasters that GIS can help predict and mitigate are:
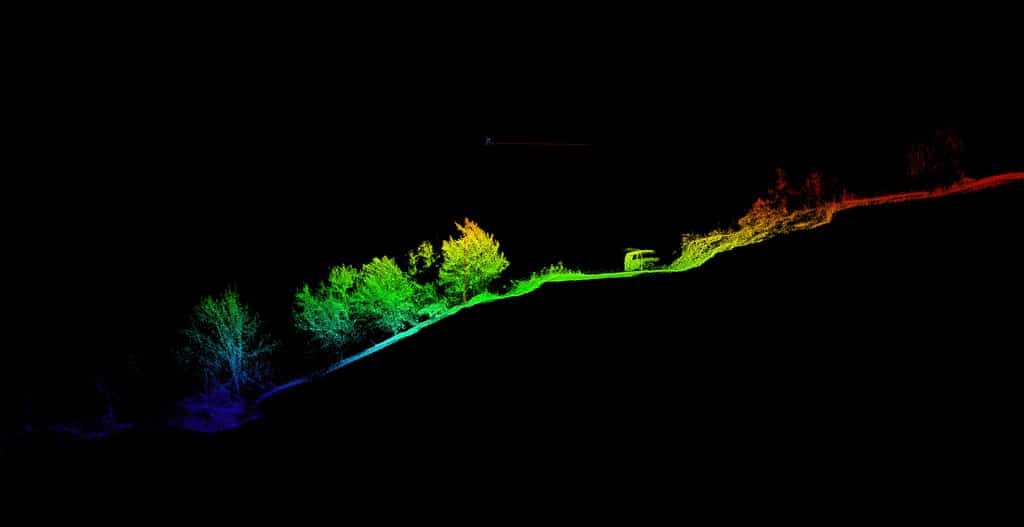
GIS systems like Airbus’s Surface Movement Monitoring (SMM) can provide early warning systems with critical landslide monitoring information.
SMM can even monitor hydroelectric or reservoir dams to millimeter accuracy, eliminating on-site surveys or personnel in-danger.
It’s also capable of watching land subsidence. As cities build onto new land and more water is used by residents and industrial activity, SMM can monitor the land height, and detect how much it sinks every year.
Did you know that the Johns Hopkins COVID-19 global dashboard is a GIS? It’s built using ArcGIS Online, and your company or department can have a dashboard just like it.
Meanwhile, rTek uses a flood simulation system called HEC-RAS, a free and open-source simulation software for scientists. Outputs from “what-if” or historical scenarios can be shared online using ArcGIS Online maps, and open data hubs with custom map layers for each area.
Did you know that Twitter is a GIS?
So are Facebook, Instagram, Snapchat, etc. Because your post is geo-located, the database can store location information for every picture, re-tweet, and post.
Apps like ESRI’s ArcGIS Online allow you to map these tweets in real-time, keeping an eye on people, and understanding exactly what problems people are reporting.
As a city authority or business, you can even use this to directly reach out to your citizens or potential customers, and keep them informed with critical information.
5. Keeping International Collaboration Alive
Monitoring prospective sites for new business are one of the primary uses for GIS. You can see economic data for streets or locations in the city, and optimize the best new location for sales, operations, or transportation.
GIS can help your business to determine if it’s best to set up a new store on 21st street facing the mall, or one block down, based on demographics, crowd modeling, and rich economic data.
ESRI’s Living Atlas of the World provides access to this rich data to any ArcGIS Online Users, even if you have no experience with GIS at all.
Many new businesses had plans in the works for opening during COVID, but have been delayed because of the inability to travel. Businesses may have resulted in using Google Street View or Google Earth, which are both GIS type applications.
With more sophisticated GIS, companies can store any information for mapping, then use it for planning and project management, even if managers are halfway across the world.
Commissioning surveys, getting up-to-date pictures or maps, and understanding your new business’ future location is on the rise in 2023.
Working remotely has led to great advances in satellite imagery. It’s much less expensive than you think to order imagery and view on your own custom map, just like Google Maps.
New commercial satellites like Capella Space’s I can’t Believe it’s not Optical enable nighttime and cloud-covered imagery of anywhere on the planet, in incredible resolution and accuracy.
Over 10 years ago, we first heard of Wall Street’s usage of satellite images: Walmart parking lots, as a tool to predict stock prices. Since then, imagery and GIS systems have 10x’d their resolution and availability.
If your company or department isn’t using GIS and space imagery, 2023 is a great time to start.
Between Rocketlab and SpaceX reducing cost-to-orbit by 90%, and new cameras and sensors mounting on hundreds of cheap cubesats allowing us to see more, faster, cheaper than ever before, it’s never been a better time to use GIS than now.


